
Welcome to the September 2025 Newsletter. This month, we’re discussing the economy, employment, financial terminology, and more.
Summary

On August 11, Bank of America (Merrill Lynch) said, “Our monthly Global Fund Managers Survey in August concluded: ‘This survey is the most bullish since February 2025, with the probability of a hard landing the lowest since January 2025. Cash, as a percent of assets under management, is at a historically low level of 3.9%. Equity allocations are on the rise, but not at extreme levels.’”
Stephanie Link, Hightower Advisors’ chief investment strategist and portfolio manager, said on August 15, “Gross domestic product is running at 2.5%, corporate profits are rising, the Fed is primed to begin cutting interest rates later this year, and the fourth quarter is being set up to be pretty good.”
Quote of the Day
Ben Franklin (1706–1790) was an American writer, scientist, inventor, statesman, diplomat, printer, publisher, and political philosopher.
He was among the most influential intellectuals of his time, one of our country’s Founding Fathers, a drafter and signer of the Declaration of Independence and the Constitution, and the first Postmaster General.
The only reason Franklin was never elected president was that he died in 1790, before George Washington left office in 1797. Except for Washington and Franklin, the other Founding Fathers were in their 20s, 30s, and 40s when our country was being formed.
As Mr. Franklin was a man of action, he once said, “Well done is better than well said!”

Pop Quiz
What is a broad difference between socialism in Europe and free market capitalism in the US?
The answer to this month’s Pop Quiz is at the bottom of the newsletter.
The Economy
Employment
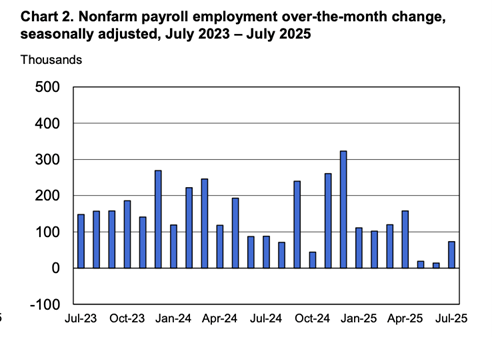
Total U.S. nonfarm payroll employment rose by a paltry 73,000 in July. The official unemployment rate, U-3, increased slightly to 4.2%. The May and June 2025 combined employment numbers were revised lower by an astounding 258,000 than previously reported. This shocking revision resulted in the firing of the commissioner of Labor Statistics.
Chart 1 below is based on the Bureau of Labor Statistics official unemployment rate, U-3.
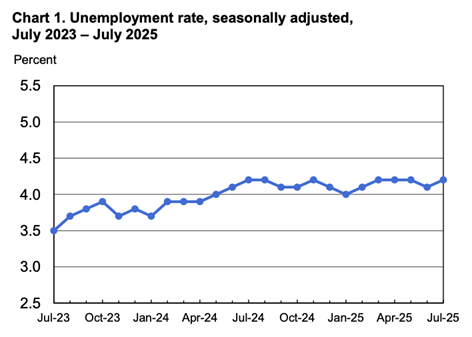
Chart 2 below shows the two-year trend of employment growth.
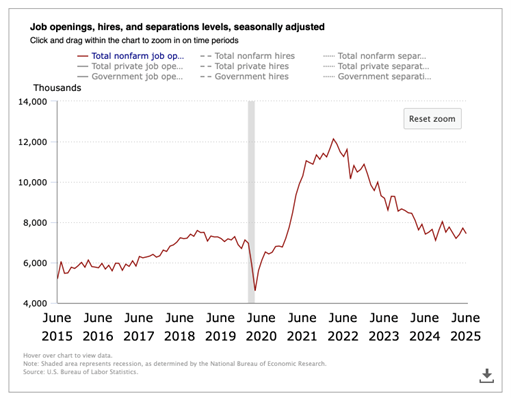
The Job Openings & Labor Turnover Survey (JOLTS) decreased slightly to 7.4 million open jobs across the country as of the last business day in June. It was 7.8 million in the prior month. The 10-year chart below shows the downward trend continues in open jobs since March 2022.
The seasonally adjusted Total U.S. Unemployment Rate, U-6, increased slightly to 7.9% in July as compared to the prior month. There were 7.8 million people unemployed in July, age 16 and older. Last month it was 7.5 million people unemployed.
July Unemployment Rates by Education Level
Average hourly earnings of all employees on private nonfarm payrolls were up 3.9% in July compared to a year ago. It was 3.7% the previous month.
| Less Than High School Diploma | 5.5% |
| High School Graduate, No College | 4.4% |
| Some College, Associate's Degree, or Skilled Trade Degree | 3.0% |
| Bachelor's Degree or Higher | 2.7% |
Leading Economic Indicators (LEI) sponsored by The Conference Board
The LEI decreased only 0.1% in July after declining 0.3% in June. The Conference Board’s spokesperson said, “Pessimistic consumer expectations for business conditions and weak new orders continued to weigh down the index. Meanwhile, stock prices remained at a key positive support level. Initial unemployment insurance claims were much lower in July than in June. The Conference Board does not currently project a recession, though we do expect the economy to weaken in the second half of 2025.”
Gross Domestic Product (GDP)
The Bureau of Economic Analysis said the second estimate for GDP in the second quarter of 2025 increased at a significant annual real rate of 3.3%! GDP for the first quarter 2025 was a minus 0.5%.
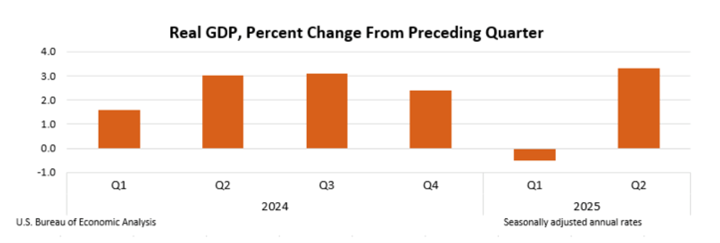
The increase in the second quarter GDP reflected a decrease in imports, which is a subtraction in the GDP calculation, and an increase in consumer spending. For the year 2024, GDP increased 2.8% and grew 3.2% in 2023.
Labor Productivity – Second Quarter data will be released in August.
Annualized and seasonally adjusted, nonfarm labor productivity increased by 2.4% in the second quarter of 2025 as reported by the Bureau of Labor Statistics. For the same quarter a year ago, labor productivity increased by 1.3%.
By calendar year, labor productivity grew a revised 2.8% in 2024 and 1.9% in 2023.
Inflation
Annual inflation remained the same at 2.6% as measured by the Personal Consumption Expenditures (PCE) price index for July. The revised annual June number was also 2.6% during the prior 12-months. The annual core PCE price index, which excludes food and energy, increased slightly in July to 2.9%. It was 2.8% in June.
University of Michigan Consumer Sentiment
Consumer sentiment in August declined to 58.2 compared to June’s revised 61.7. See the 10-year chart below.
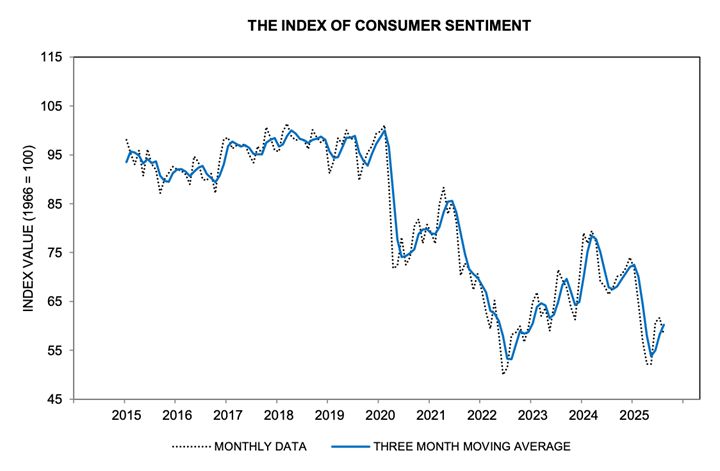
Buying conditions for durable goods subsided to their lowest reading in a year, and current personal finances declined 7%, both due to heightened concerns about high prices. Expectations for business conditions and labor markets contracted in August as well. That said, expectations for personal finances held steady this month, albeit at relatively subdued levels relative to a year ago.
Mortgage Rates and Average Existing Home Prices
As of August 29, 2025, the average 30-year fixed-rate mortgage had an interest rate of 6.50%, compared to 6.77% last month. The average 15-year fixed-rate mortgage had an interest rate of 5.86%, compared to 6.03% last month.
The median existing single-family home sale price increased in July 2025 to $428,500, up 0.3% from the previous 12 months. The volume of existing home sales increased 2.0% compared to a year earlier, according to the National Association of Realtors. The inventory of existing homes for sale increased by 0.6% compared to June. This represents a 4.6-month supply of homes for sale. The desired supply target is 6 months.
The U.S. Public Debt as Issued by the Treasury Department as of August 29, 2025, was:
$37,292,000,000,000
Last month it was $37,169,000,000,000.
Important Dates in August
THE STOCK MARKET
Commentary
Tony Pasquariello, Goldman Sachs Global Markets Manager, said on August 11, “August and September will bring more doses of consolidation, but I believe the primary trend is still higher over the second half of 2025.”
David Kostin, Goldman Sachs Chief U.S. Equity Strategist, said on CNBC on August 18, 2025, “With the 2nd quarter 2025 earnings season nearly complete, the quarter has been marked by one of the greatest frequencies of earnings beats on record. 92% of the S&P 500 index companies have now reported. Of those, 60% have beaten consensus earnings-per-share forecasts by more than one standard deviation of analysts’ estimates. This is the highest rate in our 25 years of data, outside of the Financial Crisis (2009) and the COVID (2021) recoveries.”
On August 22, Morgan Stanley’s Wealth Manager, Ellen Zentner, said on CNBC, “Labor market weakness appears to have outweighed inflation risk for the Federal Reserve. Long-term, the debate about how far and fast the Fed will cut interest rates is just beginning. Chair Powell reaffirmed the 2% inflation target during his address today in Jackson Hole, WY.”
Stock Market Valuation
On August 25, we noted the following three stock market predictions on CNBC.
Jefferies raised their S&P 500 2025 year-end target to 6,600 on resilient earnings.
UBS said, “We see room for the equity market rally to continue, with the S&P 500 reaching 6,600 by year-end, and 6,800 by June 2026.”
Ed Yardeni of Yardeni Research said, “We are sticking with our targets for the S&P 500 of 6,600 by year-end 2025 and 7,700 at the end of next year.”
Coincidentally, all three are predicting 6,600 for the S&P 500 by this year-end.
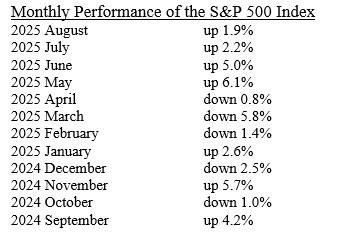
The S&P 500 Index closed on August 29, 2025, at 6,460.26. Year to date, the market is up 9.8%.
Recent Annual S&P 500 Performance As Per The Exchange Traded Fund, VOO
2024: +24.98%
2023: +26.32%
2022: -18.19%
2021: +28.78%
2020: +18.29%
2019: +31.35%
Recommended Action for Your Stock Portfolio
There is tremendous pent-up demand for housing in the U.S. Warren Buffett would go out of his way to say he does not have a macroeconomic forecast, but the last time he heavily invested in the housing market was after the dot-com bubble burst in 2001–2002. At that time, the Fed cut interest rates to fight off the recession.
Today, our country is short 5 to 7 million homes. This shortage began in 2008 during the financial crisis that was brought on by fraud in the mortgage market.
No one knows when the first-rate cut is coming, but almost everyone believes the next rate move will be lower, and it will start later this year.
We believe we are entering a multi-year bull market in house construction and financing. Here are our ideas on how to invest in the housing market.
For a diversified investment, buy the exchange-traded fund ITB, the iShares U.S. Home Construction ETF.
For individual stocks, here are our suggestions:
- D.R. Horton - DHI
- Lennar Corporation - LEN
- Lowe’s Companies - LOW
- Home Depot - HD
- Sherwin-Williams - SHW
- Rocket Companies -RKT
∙ Not FDIC Insured ∙ No Bank Guarantee ∙ May Lose Value
Financial Markets Vocabulary
This month, we are offering a challenge to parents and grandparents of junior high and high school–age students. Hopefully, the student’s high school offers a personal financial education class. If so, our challenge is to visit with the teacher of this class and make sure the class covers the following topics (shown here in no particular order).
Budgeting – Income, spending, and savings.
Savings – For an emergency fund and specific topics such as a car or home purchase.
Investments – Stocks, bonds, cash, risk management, costs, liquidity, financial needs and objectives.
Banking – Checking and savings accounts, debit cards vs credit cards.
Credit – Credit score and credit reports, costs of credit.
Net Worth – Assets vs liabilities.
Taxes – All forms.
Insurance – All forms.
Major Economic Indicators – Inflation, unemployment and gross domestic product.
Cost of Renting
Cost of Home Ownership
Cost of Vehicle Ownership
Bankruptcy
Estate Planning
If something is missing, please encourage the teacher to add the missing topics to their curriculum.
The Top 10 States for Business in 2025 by CNBC
- North Carolina (on top again!)
- Texas
- Florida
- Virginia (last year's winner)
- Ohio
- Michigan
- Georgia
- Tennessee
- Indiana (has been in the top 10 states for a long time)
- Minnesota
OK, Now What Do I Do?
The total assets in U.S. retirement accounts are a staggering $43.4 trillion! So, who is salivating and trying to get their hands wrapped around your money now? Answer: traditional brokerage houses, hedge funds, private equity funds, and, of course, the newer online brokerage houses. How might they accomplish this? By talking the federal government into allowing retirement plan administrators to offer “alternative investments.”
The traditional offerings of retirement plans are:
- publicly traded stocks, stock ETFs, and stock mutual funds, all registered with the SEC;
- publicly traded bonds, bond ETFs, and bond mutual funds, all registered with the SEC;
- and cash.
So, what are “alternative investments”? Here is a list:
- Private Equity
- Private Credit
- Venture Capital
- Real Estate Investment Trusts
- Hedge Funds
- Infrastructure Funds
- Collectibles
- Limited Partnerships
- Viatical Life Settlements
- Unit Investment Trusts
- Structured Notes
- Buffered Products
- Special Purpose Acquisition Companies
- Non-Fungible Tokens
- Crypto
- Commodities
- Life Insurance
- Annuities
So, what makes these investment options so bad? They sound interesting and sophisticated. Here is why they are potentially terrible and should be avoided like the plague!
First, the only reason brokerage houses and hedge funds are interested in getting in on this action within retirement accounts is because of the high annual fees of these types of investments. Alternative investment fees are typically 2% per year, but they will never be allowed to charge that much in a retirement account. Even if they can get away with 1% per year, that is much higher than most traditional investments in retirement accounts.
Second, the price of alternative investments is not updated daily like the stock and bond markets. So just because the administrator says the price of XYZ private equity fund is $10 per share, that price could easily be six months or even a year old. You will never really know if you are making or losing money for a long time.
Third, the transparency of the contents of an alternative investment is near zero. An example could be a private credit fund that decides to buy $150 million of bonds issued by the fictitious State Bank of Bozeman, Montana. Is that private bank doing great, mediocre, or in terrible financial shape? Well, you cannot go to Morningstar or Lipper and get a rating on that private bank or any private company, so you have no source of information to independently verify financial information. You have to trust the private credit guys that they have made a good decision with YOUR money – it’s not THEIR money!
Fourth, there is no hiding from market forces just by being in an alternative investment, even though it is advertised that private investments do not fluctuate like public investments. When interest rates go up, the price of existing bonds goes down – both public bonds and private bonds! There are no ifs, ands, or buts. The price of all existing bonds goes down when interest rates go up! So alternative investments do not offer lower volatility, no matter what they advertise.
Fifth, and perhaps the most loathsome, the liquidity of alternative investments – the idea of how quickly a client can sell – is significantly restricted. An example might be that a client can only sell a maximum of 20% of their alternative investment each year, and only during the month of November by giving the fund manager written notification between August 1 and August 31 of the same year.
It is the opinion of Lorenz Financial that this new idea of alternative investments, inside or outside of a retirement account, is terrible and should be avoided without hesitation.
• Not insured by any bank or government • Subject to risk & possible loss of principal
Our Financial Bad Boy This Month
Fidelity Investments seems to have multiple issues, as per the list below.
May 2025 – A Fidelity subsidiary, National Financial Services, was fined for computer programming errors that caused delays of months for over 5,600 customer transfers.
February 2025 – A Better Business Bureau complaint describes “incompetent” service, and internal errors led to endless phone calls and delays for a pension plan trying to process payments.
January 2025 – Fidelity agreed to pay a $600,000 fine to FINRA for failing to supervise a Fidelity employee who stole $750,000 from customer accounts.
October 2024 – A class action lawsuit accused Fidelity of overcharging shareholders in its Government Money Market Fund by failing to automatically convert eligible customers to a lower-cost share class.
August 2024 – Fidelity reported a breach affecting over 77,000 customers after a hacker accessed personal data, including Social Security numbers.
March 2024 – Fidelity customers’ information was exposed through a third-party breach, with Fidelity being accused of negligence and failing to adequately protect its network.
2018 – Fidelity employees won a lawsuit against Fidelity for including too many proprietary Fidelity mutual funds in its employee 401(k) plan, causing employees to incur higher fees and poorer fund performance.
These are just some examples of accusations and judgments against Fidelity. Many brokerage houses will eventually find themselves in similar situations. The real question is: is your broker getting better each year, as they should be?
The Bond Market
Commentary
On August 22, Jeremy Siegel, finance professor at the Wharton School in Pennsylvania, said on CNBC, “I would not be surprised to see a 25-basis-point cut in each of the next three FOMC meetings (September, November, December). I think it’s appropriate for the Federal Funds rate (the target range is now 4.25% to 4.50%) to be a full percentage point below the 10-year Treasury (now at 4.23%).
I am not surprised at the jump in stock prices today following the Fed Chair’s speech. We should expect more upside to equities.”
Recommended Action for Your Safest Money
Our recommendations for an investor’s safest money have not changed from last month. Our recommendations, in no particular order, are:
Our recommendations, in no particular order, are:
- Short-term U.S. investment-grade corporate or securitized bond funds.
- FDIC bank CDs paying at least 4%. Some banks are paying almost nothing.
- U.S. Treasury bills of 1 year, or Treasury notes of 2, 3, or 4 years.
- Bank or brokerage-house high-yield savings or money market accounts (4% min.).
- U.S. Savings I-Bonds, which have a max contribution of $10,000 per account per year, are tax deferred for 30 years, do not drop in value like a bond drops in value when interest rates go up, interest is paid and compounded monthly, and the interest rates vary every six months based on inflation.
Due to the relatively low return of these investment products, investors should not put 100% or anything close to that in these products. These products are only for an investor’s safest money, or perhaps 5% to 30% of an investor’s total portfolio. These products are credit-safe, but they will not provide the growth or income needed to stay ahead of, or even keep up with, taxes and inflation.
Past performance is not a guarantee of future results.
Pop Quiz Answer
What is a broad difference between socialism in Europe and free market capitalism in the US?
Answer:
In European socialism, the employee is more important than the customer. In US free market capitalism, the customer is more important than the employee.