
Welcome to the March 2025 Newsletter. This month, we’re discussing the economy, employment, financial terminology, and more.
Summary

On February 25, 2025, Rick Rieder, Blackrock Chief Investment Officer of Global Fixed Income, said on CNBC, “If an investor focuses on every single headline, you can really get distracted. Instead, focus on the big picture.”
- “Technology is still going to take us to the next level.”
- “Focus on what is coming – continuation of the 2017 tax cuts, deregulation, and a better economy.”
- “We still have low unemployment and a good wage growth.”
- “I’m confident the economy is in good shape.”
- “I think by year end the US stock market will give us a low, double-digit return (10% to 12%).”
Quote of the Day
Jensen Huang, founder, President and CEO of Nvidia, recently said,
“Artificial Intelligence (AI) is not going to take your job. The person who uses AI is going to take your job.”

Pop Quiz
If savings and investments grow at 8% a year, how much does an investor have to save per month over 40 years to accumulate $1 million? How much if saving for 30 years? If only 20 years? If only 10 years?
The answer to this month’s Pop Quiz is at the bottom of the newsletter.
The Economy
Employment
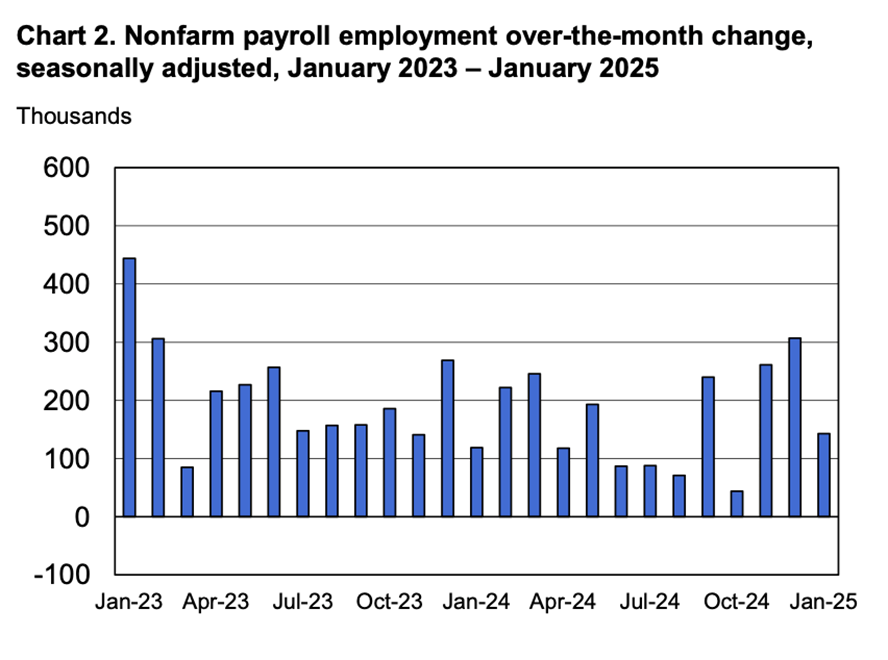
Total U.S. nonfarm payroll employment rose by 143,000. The official unemployment rate, U-3, decreased to 4.0%. The November and December 2024 combined employment numbers were revised higher by 100,000 than previously reported.
Chart 1 is based on the Bureau of Labor Statistics official unemployment rate, U-3.
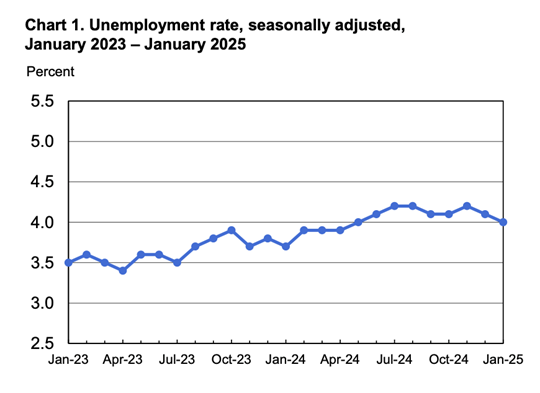
Chart 2 shows the two-year trend of employment growth.
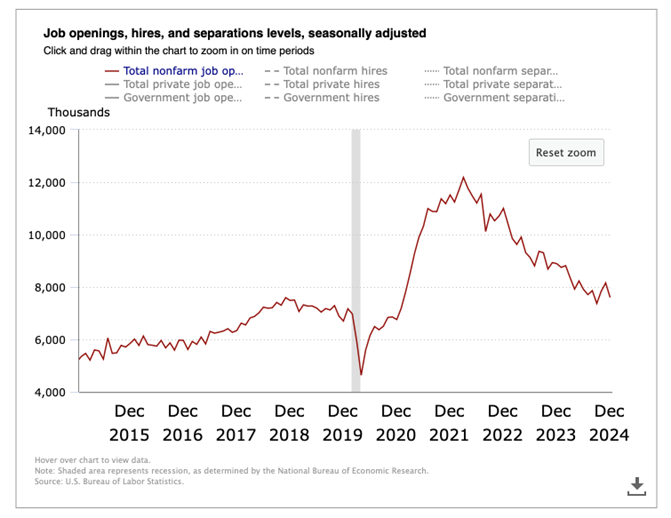
The Job Openings & Labor Turnover Survey (JOLTS) decreased to 7.6 million open jobs across the country as of the last business day in December. It was 8.1 million in the prior month. Even though the October and November JOLTS data showed an increase in open jobs, the 10-year chart below shows the downward trend continues in open jobs since March 2022.
The seasonally adjusted Total U.S. Unemployment Rate, U-6, remained the same at 7.5% in January as compared to the prior month. There were 7.5 million people unemployed in January, age 16 and older. Last month it was 6.5 million people unemployed. No explanation was given for the dramatic increase.
January Unemployment Rates by Education Level
Average hourly earnings of all employees on private nonfarm payrolls were up 4.1% in January compared to a year ago. It was 3.9% the previous month.
| Less Than High School Diploma | 5.2% |
| High School Graduate, No College | 4.5% |
| Some College, Associate's Degree, or Skilled Trade Degree | 3.5% |
| Bachelor's Degree or Higher | 2.3% |
Leading Economic Indicators (LEI) sponsored by The Conference Board
The LEI decreased 0.3% in January. The Conference Board’s spokesperson said, “Consumers’ assessments of future business conditions turned more pessimistic in January, which drove the monthly decline. Overall, just four of the LEI ten components were negative in January. The LEI six-month and annual growth rates continued to trend upward, signaling milder obstacles to US economic growth We currently forecast GDP for the US will expand by 2.3% in 2025.”
Gross Domestic Product (GDP)
The Bureau of Economic Analysis said the second estimate for GDP in the fourth quarter of 2024 rose at an annual real rate of 2.3%. GDP for the third quarter 2024 was 3.1%.
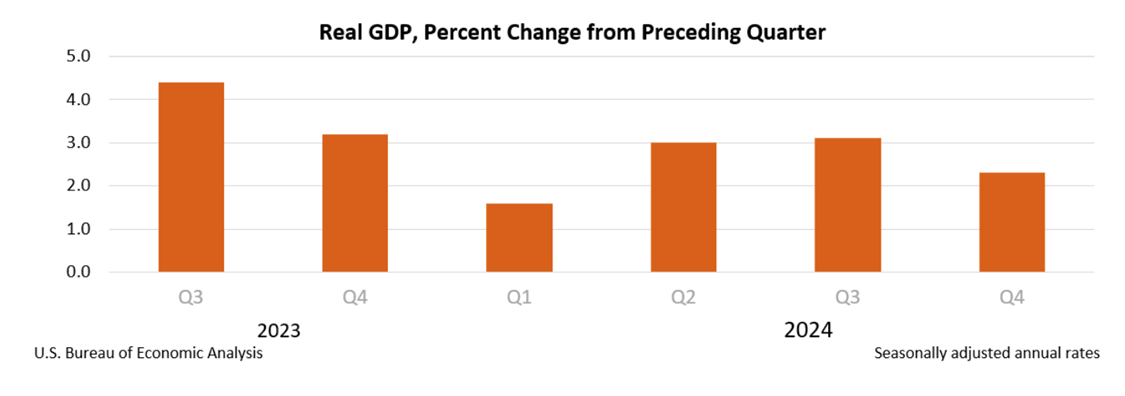
The increase in the fourth quarter GDP reflected an increase in consumer spending and government spending. For the year 2024, GDP increased 2.8% and grew 3.2% in 2003.
Labor Productivity – Quarterly
Annualized and seasonally adjusted, nonfarm, business sector labor productivity increased 1.2% in the fourth quarter of 2024 as reported by the Bureau of Labor Statistics. For the same quarter a year ago, the increase was 1.6%.
By calendar year, labor productivity grew 2.3% in 2024 and 1.6% in 2023. For gross domestic product (GDP) to continue to grow, our country needs population growth, or productivity growth or more realistically, both.
Inflation
Annual inflation decreased slightly to 2.5% as measured by the Personal Consumption Expenditures (PCE) index for January. It was 2.6% in the 12-months ending in December. Core PCE index, which excludes food and energy, decreased to 2.6% in January. It was 2.8% in December.
University of Michigan Consumer Sentiment
Consumer sentiment in February had a substantial drop to 64.7, as compared to January’s 71.7. See the 10-year chart below.
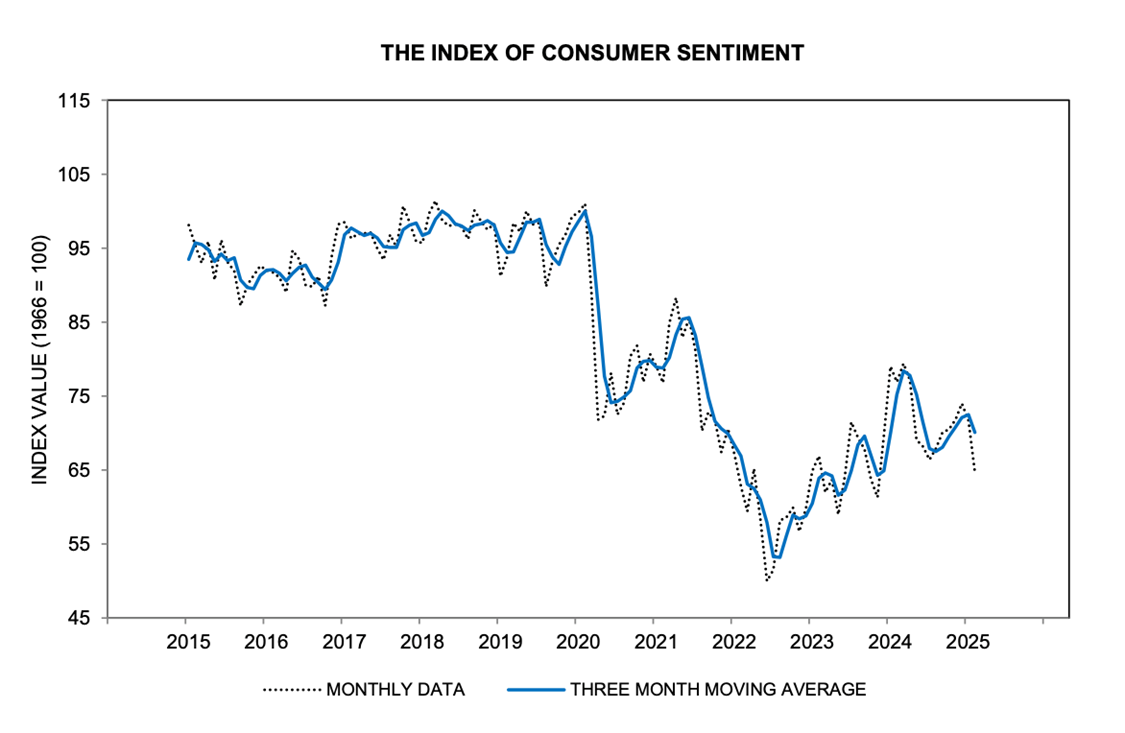
The sentiment decrease was unanimous across all groups by age, income and wealth. All index components deteriorated this month, led by a 19% plunge in buying conditions for durable goods.
Mortgage Rates and Average Existing Home Prices
As of February 28, 2025, the average 30-year fixed-rate mortgage had an interest rate of 6.79%, compared to 7.05% last month. The average 15-year fixed rate mortgage had an interest rate of 6.25%, compared to 6.47% last month.
The median existing home sale price slid in January 2025 to $396,900 from $404,400 the month before. But that is still a 4.8% increase compared to January 2024 according to the National Association of Realtors. The inventory of existing homes for sale increased slightly to a 3.5-month supply in January. The desired supply target is 6 months.
The U.S. Public Debt as Issued by the Treasury Department as of February 28, 2025, was:
$36,536,000,000,000.
Last month it was $36,421,000,000,000.
Important Dates in March
THE STOCK MARKET
Commentary
Tony Pasquariello, Goldman Sachs Global Head of Hedge Fund Coverage on CNBC.
Tony said in February, “A lot is going on. Seasonally, what’s happening is what generally happens – the last two weeks of February are the worst two weeks of the year.”
“We feel pretty good about the core underpinnings of the market. Growth has clearly slowed in the first quarter, but we believe full year GDP growth will be 2.5%.”
“In a way, I think we were spoiled in 2023 and 2024 when the market was so consistent and delivered so much strength. Now we have evolved into a more normal market.”
Stock Market Valuation
Aswath Damodaran, Professor of Finance at the NYU Stern School of Business.
Professor Damodaran said in February on CNBC, “I started this year by estimating the stock market was overvalued by 12%. Given the current corporate earnings cash flow and growth, this looks like an expensive market, but we are not in a bubble.”
“There is some ‘cleansing’ that is needed in this market because momentum is being rewarded too much.”
If the professor is right, what should be held and what should be done? Lorenz Financial suggests the following:
- Make sure your portfolio reflects your current attitude towards risk and volatility. We all tend to get more conservative as we get older.
- For those working, continue to save as much as you can each pay period. Dave Ramsey recommends saving 15% of your family’s gross annual income. That sounds like good advice.
For everyone, if we are entering another downturn, just ride it out. Even in the Great Depression, the stock market did not go to zero. Look how nicely the market has recovered from the 2008-2009 Financial Crisis, COVID in 2020, and the recession in 2022. Plan and execute for the long term, and don’t fret about the short term.
The S&P 500 Index closed on February 28, 2025 at 5,954.50.
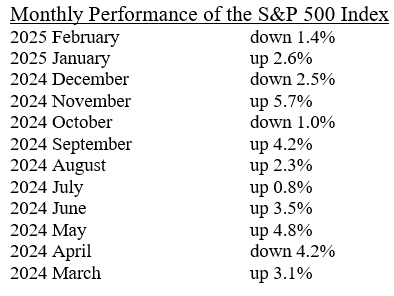
Note how the market has jumped around the last six months with three months down and three months up.
Prior Annual S&P 500 Performance As Per The Exchange Traded Fund, VOO
2024: +24.98%
2023: +26.32%
2022: -18.19%
2021: +28.78%
Recommended Action for Your Stock Portfolio
Question: Should an investor structure their taxable brokerage accounts differently than how they construct their IRA accounts?
Yes! Besides making sure all of an investor’s accounts are highly diversified and very low cost, an investor’s taxable accounts must also be tax efficient. OK, so how does one do that?
Most investments throw off interest, or dividends or capital gains during the time of ownership. If so, these will cause taxes to go up, now or later, unless the investments are in a Roth IRA. An investor who is not looking for income but only long-term gains, will expect an asset in a taxable account to show a profit when it is sold – and hopefully no capital gains during the years of ownership. But mutual funds and even some exchange traded funds (ETFs) will have dividends and capital gains during each year causing additional annual taxes. Is one asset better than the other in a taxable account? Yes!
Broadly, exchange traded funds have capital gains distributions each year that are lower than mutual fund annual distributions. Taxable accounts should therefore contain copious amounts of ETFs and zero mutual funds. Why do ETFs have a taxable advantage during the years of ownership? Two reasons.
First ETFs have a unique mechanism for buying and selling. ETFs use creation units that allow for the purchase and sale of assets in the fund collectively. This means ETFs usually don’t generate the quantity of capital gains distributions that mutual funds do and therefore ETFs don’t see the high annual tax consequences.
Second, the majority of ETFs are passively managed, which in itself creates fewer transactions because the portfolio only changes when there are changes to the underlying index.
Therefore, please maximize the use of ETFs and minimize the use of mutual funds in a taxable brokerage account. This will reduce an investor’s annual tax liability.
• Not FDIC Insured • No Bank Guarantee • May Lose Value
THANK YOU STATE OF INDIANA!
Here are some recent past, present and future personal income tax rates for the state of Indiana.
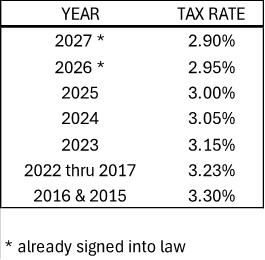
Indiana county income tax rates are added to the state’s income tax rate. For example, Tippecanoe County in Indiana has a county income tax rate of 1.28%. Therefore, Indiana residences in Tippecanoe County have a combined state and local income tax rate of 4.28% in 2025.
Financial Markets Vocabulary
What is the wash sale rule?
A wash sale occurs when an investor sells a security at a loss and repurchases the same asset within 30 days (before or after) the date of sale all within a taxable brokerage account. Any loss from a wash sale cannot be used to offset gains from other asset sales from the investor’s portfolio when filing their income taxes.
Example:
- Investor owns 100 shares of XYZ with a cost basis of $5,000.
- Investor sells 100 shares of XYZ on December 10 for $4,200.
- Investor buys 100 shares of XYZ on December 31 for $4,000.
This is a wash sale as the investor repurchased the same security within 30 days of the sale which resulted in a loss. The investor cannot deduct the loss of $800 from their taxes in this example.
The investor could have purchased a different, but similar, security on December 31 and then would have been eligible to deduct the $800 loss. For example, the investor could have originally invested $5,000 in GM stock. Then sold the stock for an $800 loss on December 10. Then on December 31 bought shares of Ford. In this example, the investor would have then been eligible to deduct $800 as a capital loss on GM stock on their income taxes.
The wash sale rule applies to stocks, bonds, mutual funds, exchange traded funds, and options in a taxable account.
OK, Now What Do I Do?
Correction – Last month we listed how the worldwide automobile industry is consolidating. At that time a merger was underway between Honda and Nissan. Now the merger has been called off.
At Lorenz Financial, we stopped following the Dow Jones Industrial Average and began focusing on the S&P 500 Index in the 1990s. Why? We have two reasons.
Both stock indexes are widely followed, but the Dow Jones index only tracks 30 large US companies while the S&P 500 tracks of course the 500 largest US companies. If an investor’s objective is to follow a stock index that reflects upon the US stock market as a whole, then it's better to track the progress of the index that follows 500 companies rather than just 30 companies.
But just as important, it’s how the two indexes are constructed that drives us to favor the S&P 500 index. The Dow Jones index is a price-weighted index. Currently, the highest-priced stock per share in the Dow is Goldman Sachs at $622 per share. The lowest-priced stock per share is Verizon at $43. If 29 of the 30 stocks in the Dow Jones index remain constant on a given day and only Goldman Sachs goes up 5%, then the index will move much higher than if Verizon was the only stock that went up 5% that day. Why follow a stock index that goes up and down more if the highest-priced stocks move up or down as compared to the lowest-priced stocks?
The S&P 500 index is a market capitalization (market cap) weighted index. The market cap of a stock is determined by multiplying the number of outstanding shares times the current share price. We believe this is a better way to construct a major stock index and therefore we closely follow the S&P 500 index.
What is a good ETF to use that follows the S&P 500 index? We use VOO (that is V, Oh, Oh).
Our Financial Bad Boy This Month
Ex-House Speaker Convicted of Bribery and Wire Fraud
The Wall Street Journal, February 13, 2025, Page A2
On February 12, 2025, jurors convicted former Illinois House Speaker Michael Madigan of 10 counts of bribery and wire fraud. Madigan, 82, was a Chicago Democrat who once set much of the Illinois political agenda. Having served in the Illinois House from 1970 to 2021, he was also the longest-serving legislative leader in U.S. history.
Madigan left the courthouse without addressing reporters after the verdict.
Madigan sets the perfect example for the need for term limits for state and federal, house, and senate legislators!
The Bond Market
Commentary
Here are answers by Jan Hatzius, Goldman Sachs Head of Global Investment Research, on February 7, 2025 when asked a couple of questions on CNBC.
Question: Might the Federal Reserve hike interest rates this year?
Answer: “I think it’s very unlikely the Fed will raise interest rates this year. I think the Fed is quite comfortable being ‘on hold’ because they think current rates are restrictive.”
“We are still expecting a couple of rate cuts in 2025, but I think the risk is the Fed will keep interest rates at current levels for a while to fight inflation. The economy is still growing at a good pace, so interest rate hikes seem unlikely.”
Question: How concerned should investors be about an increase in inflation?
Answer: “I am not overly worried. If you look at the indicators of wage inflation for example, there really is no evidence that we are getting a rebound in wage growth” (or wage inflation).
Recommended Action for Your Safest Money
Our recommendations for an investor’s safest money have not changed from last month.
Our recommendations, in no particular order, are:
- Short-term U.S. Investment-Grade Corporate or Securitized bond funds.
- Short-term high-yield bond funds.
- U.S. Savings I-Bonds which have a max contribution of $10,000 per account per year.
Due to the relatively low return of these investment products, investors should not put 100% or anything close to that in these products. These products are only for an investor’s safest money or perhaps 5% to 25% of an investor’s total portfolio. These products are credit safe, but they will not provide the growth or income needed to stay ahead of, or even keep up with, taxes and inflation.
Past performance is not a guarantee of future results.
Pop Quiz Answer
If savings and investments grow at 8% a year, how much does an investor have to save per month over 40 years to accumulate $1 million? How much if saving for 30 years? If only 20 years? If only 10 years?
Answer:
If savings and investment grow at 8% per year, here is how much must be saved per month to accumulate $1 million over various time periods.
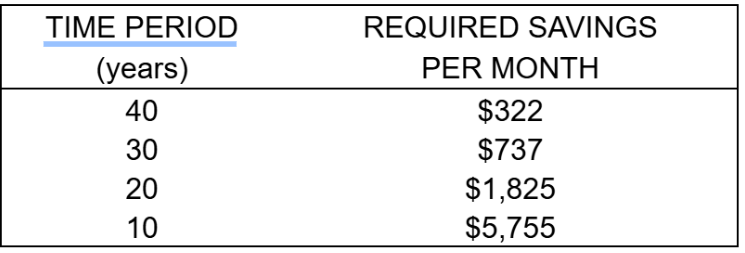
Parents and grandparents, don’t you have a 20- or 30-year-old in your family who needs to know and grasp the importance of this?