Welcome to the May 2026 Newsletter. This month, we’re discussing the economy, employment, financial terminology, and more.
Summary
Gross Domestic Production in the first quarter rose 2.0%. That’s a good start to a recovery following the government shutdown late last year. The Department of Labor’s Average Weekly Unemployment Initial Claims, a leading indicator, continues to show strong evidence that a recession is not imminent. The press continues to whine about the high price of gasoline but American families on average spend only 3% to 4% of their family income on gasoline. In the meantime, consumers have continued their spending as reported by the banking sector. Our economy is very strong, especially compared to the rest of the developed world (Canada, Europe, UK, Ireland, Japan, Taiwan, South Korea, Singapore, and Australia).
In the intermediate and long-term, the price of oil will be coming down very significantly due to worldwide supply exceeding demand. Where will the additional supply come from? Iran and Venezuela will be ramping up, and the UAE will no longer be restricted in the amount OPEC authorizes them to produce. Easily 2 to 3 million barrels of oil per day will exceed worldwide demand.
The S&P 500 Index set another all-time closing high on April 30, 2026, at 7,209.01. On March 31, 2026, the index closed at 6,528.52. This represented an increase of 10.4% during April! It is not wise to try and predict the stock market in the short-term, but we are optimistic for both the economy and the stock market in the intermediate-term and long-term.
Quote of the Day
Adam Smith published his remarkable book, "The Wealth of Nations," in 1776. This book is considered the foundation of modern economics and remains one of the most influential books in human history. Its publication marked a “sea change” in economic thought, shifting global perspective away from mercantilism and towards today’s industrial capitalist system.
Going beyond economics in his book, Smith defined three specific responsibilities of a sovereign state.
- National Defense – protecting its society from the violence and invasion of other nations or groups.
- Administration of Justice – protecting every citizen from the injustice and oppression of others.
- Public Works and Institutions – building and maintaining infrastructure (roads, bridges, seaports, and later, airports and national parks), providing a quality education to society’s children, and all other initiatives that are not profitable for a private company to provide but are beneficial to the nation’s people.
Somehow Congress has concluded our federal government should therefore spend $7,400,000,000,000 this fiscal year so that we might pursue happiness.
Pop Quiz
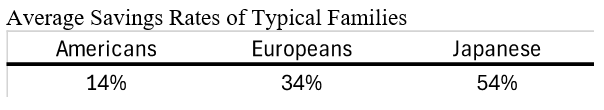
How do governments calculate their country’s personal savings rate? Also, on average, how do saving rates differ between Americans, Europeans, and Japanese?
The answer to this month’s Pop Quiz is at the bottom of the newsletter.
The Economy
Employment
Total U.S. nonfarm payroll employment increased by a surprisingly high 178,000 in March. The official unemployment rate, U-3, decreased to 4.3%. The January and February 2026 combined employment numbers were revised lower by 7,000 than previously reported.
Chart 1 below is based on the Bureau of Labor Statistics official unemployment rate, U-3.
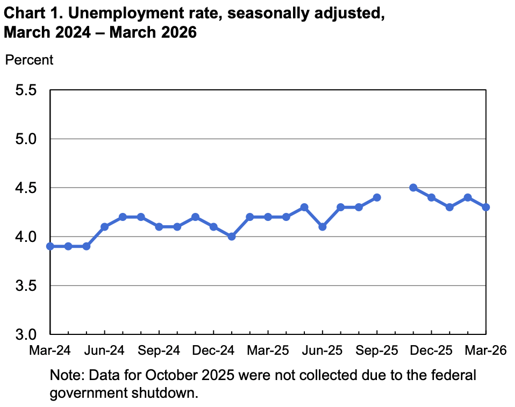
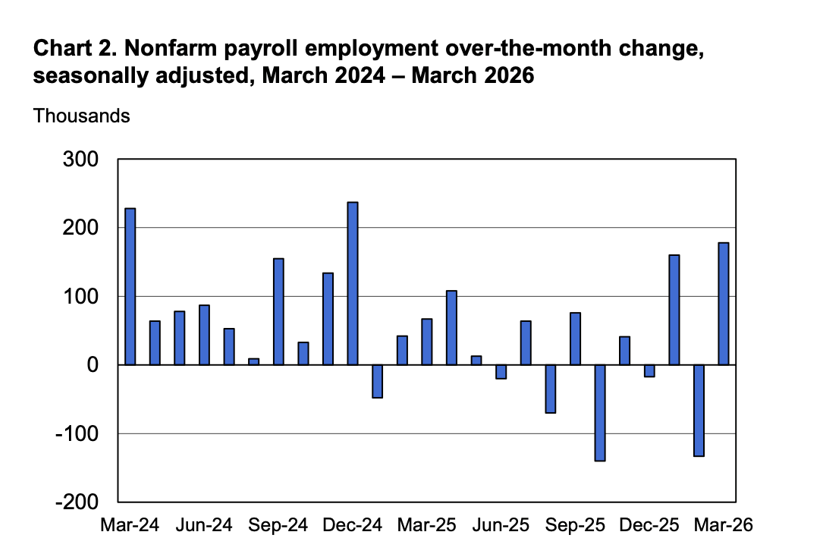
Chart 2 below shows the two-year trend of employment growth.
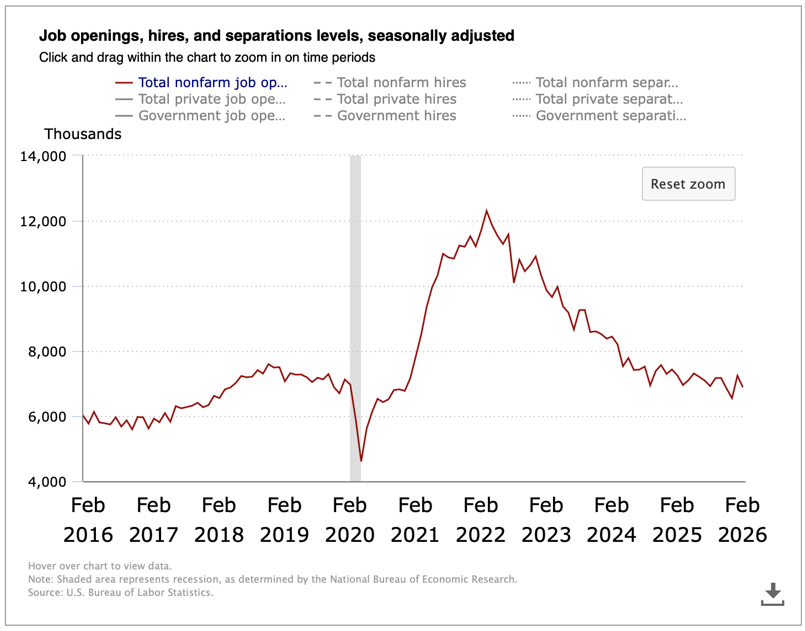
The Job Openings & Labor Turnover Survey (JOLTS) decreased to 6.9 million open jobs across the country as of the last business day in February. It was 7.2 million in January.
The 10-year chart below shows the downward trend continues in open jobs since the peak in March 2022.
The seasonally adjusted Total U.S. Unemployment Rate, U-6, increased to 8.0% in March as compared to 7.9% in February. There were 7.3 million people unemployed in March, age 16 and older. In February, there were 8.1 million people unemployed.
March Unemployment Rates by Education Level
Average hourly earnings of all employees on private nonfarm payrolls were up 3.5% in March compared to a year ago. It was 3.8% in February.
| Less Than High School Diploma | 5.9% |
| High School Graduate, No College | 4.7% |
| Some College, Associate's Degree, or Skilled Trade Degree | 3.6% |
| Bachelor's Degree or Higher | 2.8% |
Gross Domestic Product (GDP)
The Bureau of Economic Analysis said the advance estimate for GDP in the first quarter of 2026 increased at an annual real rate of 2.0%.
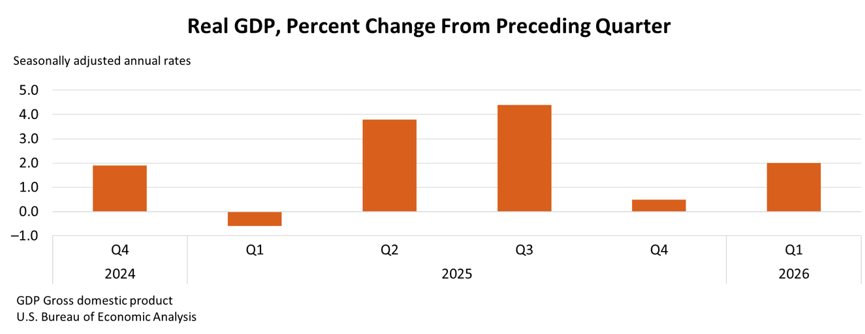
The increase in the first quarter GDP reflected an increase in exports, consumer spending, and government spending. These increases were offset by increases in imports, which is a subtraction in the GDP calculation. For the year 2025, GDP increased by 2.1%, in 2024 GDP increased by 2.8%, and grew 2.9% in 2023.
Leading Economic Indicators (LEI) sponsored by The Conference Board
The LEI declined by 0.6% in March after reversing the February increase of 0.3%. The Conference Board’s spokesperson said, “The LEI continues to signal a slowdown in the economy over the coming months, as higher oil prices and supply chain tensions will likely place additional upward pressure on inflation and further reduce consumer’s purchasing power.”
The 4-Week Moving Average of Initial Unemployment Claims
The week of April 25, initial nationwide unemployment claims came in at 207,500. See the 5-year chart below from the St. Louis Federal Reserve Bank. The higher the graph, the more likely a recession is pending. A reading of 350,000 to 375,000 of weekly initial unemployment claims would indicate an approaching recession, but we are nowhere near those levels.
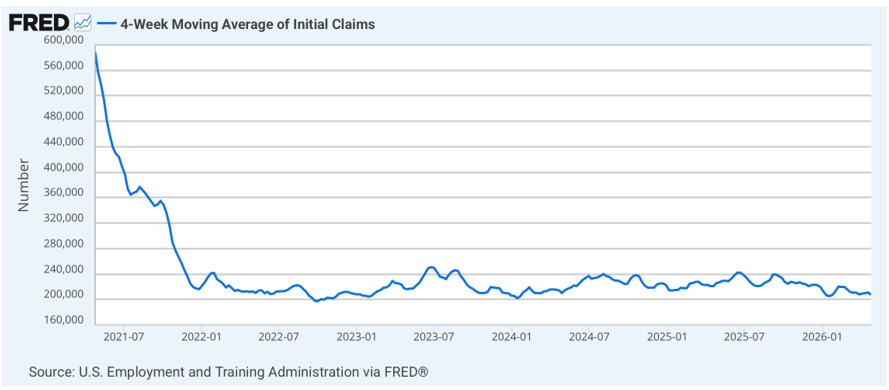
The high number of initial unemployment claims on the left of the chart was the result of the Federal Reserve increasing interest rates seven times in 2022. This resulted in an economic contraction in 2022 and significant labor layoffs that began in mid 2021.
Labor Productivity (quarterly releases only. 1st Qtr 2026 data will be released in early May)
Annualized and seasonally adjusted, nonfarm, labor productivity increased by 1.8% in the fourth quarter of 2025 as revised by the Bureau of Labor Statistics on March 24. For the year 2025, labor productivity increased at an annual rate of 2.5% as compared to the previously reported 2.1%.
By calendar year, labor productivity grew 2.3% in 2024 and an anemic 1.6% in 2023.
Inflation
Annual inflation decreased slightly to 2.8% as measured by the Personal Consumption Expenditures (PCE) price index for January. The revised annual December number was 2.9%. The annual core PCE price index, which excludes food and energy, increased slightly in January to 3.1% from 3.0% in December.
University of Michigan Consumer Sentiment
Consumer sentiment in April decreased to 49.8 compared to March’s revised 53.3. See the 10-year chart below.
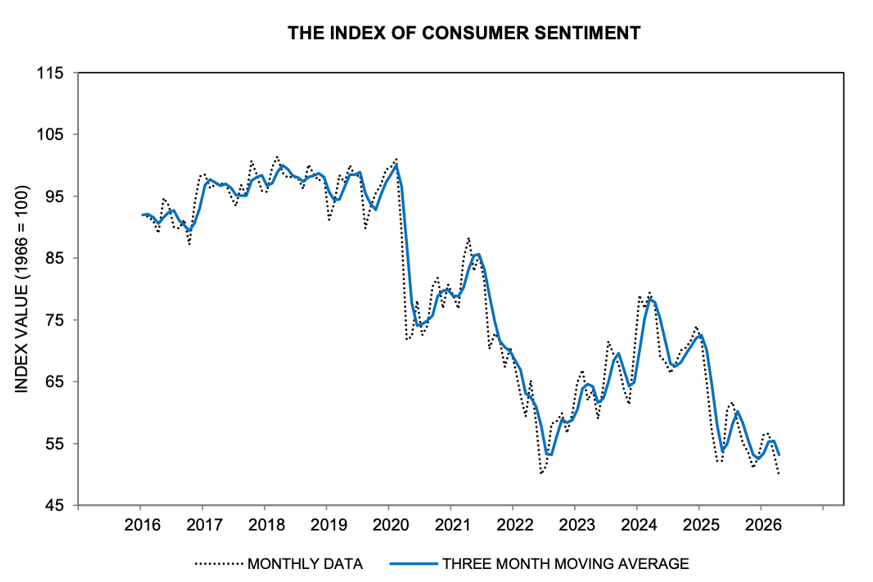
After the two-week cease-fire was announced and gas prices softened a touch, sentiment recovered a modest amount from its early-month losses. The Iran conflict appears to influence consumer views primarily through shocks to gasoline and potentially other prices.
Mortgage Rates and Average Existing Home Prices
As of April 30, 2026, the average 30-year fixed-rate mortgage had an interest rate of 6.45% compared to 6.47% last month. The average 15-year fixed rate mortgage had an interest rate of 6.01%, compared to 6.03% in the previous month.
The median existing single-family home sale price increased in February 2026 to $408,800. That was up 1.4% compared to 12 months earlier. The seasonally adjusted annual rate of existing home sales decreased 1.0% compared to a year earlier, according to the National Association of Realtors. The inventory of existing homes for sale increased by 2.3% compared to March 2025. This represents only a 4.0-month supply of homes for sale.
The U.S. National Debt as Issued by the Treasury Department as of April 30, 2026, was:
$39,184,000,000,000.
Last month it was $39,059,000,000,000.
Important Dates in May
THE STOCK MARKET
Commentary
After a fantastic stock market in April, not much has changed in terms of the likelihood the market will continue to increase. Neither has the “Wall of Worry” changed much which is always trying to push the market lower. Here are our thoughts.
The best thing driving this stock market up is that corporate profits are very strong. Unfortunately, there is more than one negative drag on the market. These include the Iran War, oil priced around $100 a barrel, inflation threatening to increase, and the Fed is not likely to lower interest rates anytime soon.
What sectors do we think are likely to grow moderately to fast the rest of this year?
- Data center construction
- Upgrading our 30 to 50-year-old electrical grid
- Adding more power plants
- Cyber security software
- Retail dominated by Amazon, Walmart, and Costco
- The magnificent seven stocks, except Lorenz Financial is not a fan of Tesla
- Chip manufacturers
- Chip equipment manufacturers
- And the highly profitable industrial, health care, energy, and financial companies
But if in doubt as to what to invest in, just buy the S&P 500 Index, VOO.
Stock Market Valuation
On April 14, a representative from Goldman Sachs, said on CNBC, “We are maintaining our year-end prediction for the S&P 500 Index to reach 7,600.”
Also on April 14, Mike Wilson, Chief Investment Officer at Morgan Stanley, said, “The lows are in for the year for the S&P 500 Index.” Note the recent low was 6,343.72 on March 30, 2026.
The S&P 500 Index closed on April 30, 2026 at 7,209.01. Year to date, the Index, as per the exchange-traded fund, VOO, is up 5.67% . This fund includes dividends.
- Markets are volatile · Always consult your financial advisor before investing
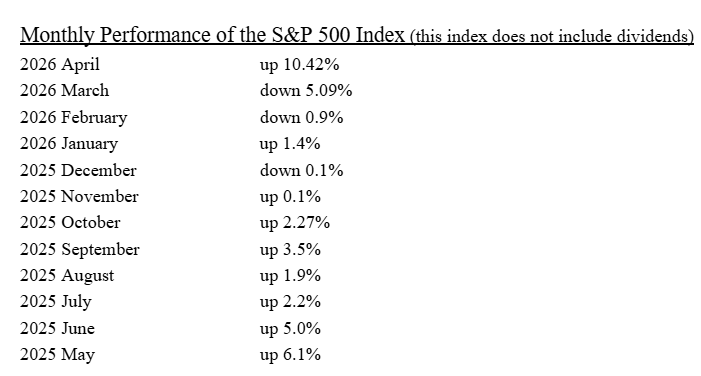
Recent Annual S&P 500 Performance As Per The Exchange Traded Fund, VOO
2025: +17.82%
2024:+24.98%
2023: +26.32%
2022: -18.19%
2021: +28.78%
2020: +18.29%
2019: +31.35%
Recommended Action for Your Stock Portfolio
There is no doubt; in the long term, the tortoise always wins!
Below is a chart of the S&P 500 Index over the past 50 years. Going left to right, the significant downturns have been:
- Black Monday – October 1987, down 20.5% in one day.
- Dot Com Bubble – January 2000 to March 2003, down 46.6% in 39 months.
- Great Recession – October 2007 to March 2009, down 56.8% in 18 months.
- COVID – February 2020 to March 2020, down 33.9% in one month.
- 2022 Recession – Down 18.2% for the calendar year.
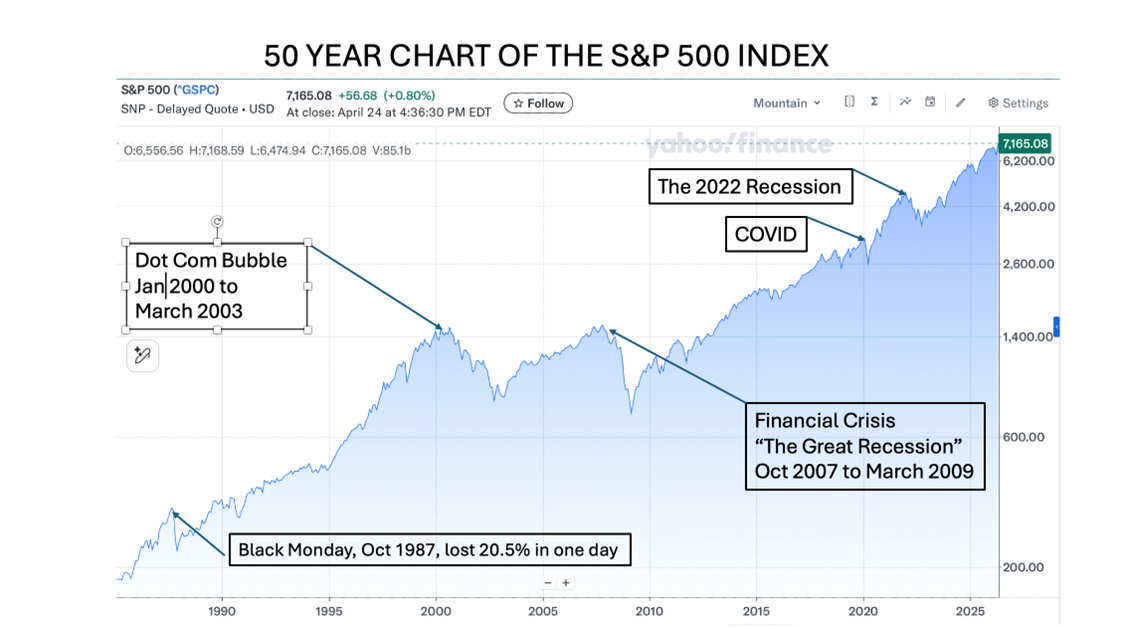
But even with these downturns, the S&P 500 Index has averaged an annual return of 8.7% without dividends. With the annual S&P 500 dividend rate varying over the past 50 years from a 5.5% high to a 1.1% low, and with the compounding effect of those dividends over 50 years, the S&P 500 Index with dividends has returned on average 11.7% per year since 1976!
The point is, long-term investors will beat out short-term traders. Be a long-term investor by relying on your patience and courage. Don’t be afraid of a little 20% downturn. That’s just a pothole in the highway that is guiding you to building substantial wealth over your lifetime.
∙ Not FDIC Insured ∙ No Bank Guarantee ∙ May Lose Value
Financial Markets Vocabulary
What is “mean reversion”?
Mean reversion is the financial theory suggesting that asset prices and historical annual returns will eventually return to their long-term averages after an extreme move in either direction.
For example, below is a 40-year chart of the price/earnings chart of Caterpillar. Its historical mean has been 18.5. But some years the company’s PE ratio is below the 18.5 line, and some years it is above. As its 2025 PE ratio is above the mean, and so far in 2026 it is also above the mean, likely that there will be one or more years in the future where the company’s PE ratio will fall below the 18.5 average. The theory implies the long-term mean of Caterpillar’s PE @ 18.5 will remain constant. In other words, when a company’s stock price drops, it is likely to not stay down, and when a company’s stock price skyrockets, it will likely not stay in its markedly upward trend forever. What can permanently interrupt this mean reversion? Bankruptcy, such as the recent failure of Spirit Airlines.
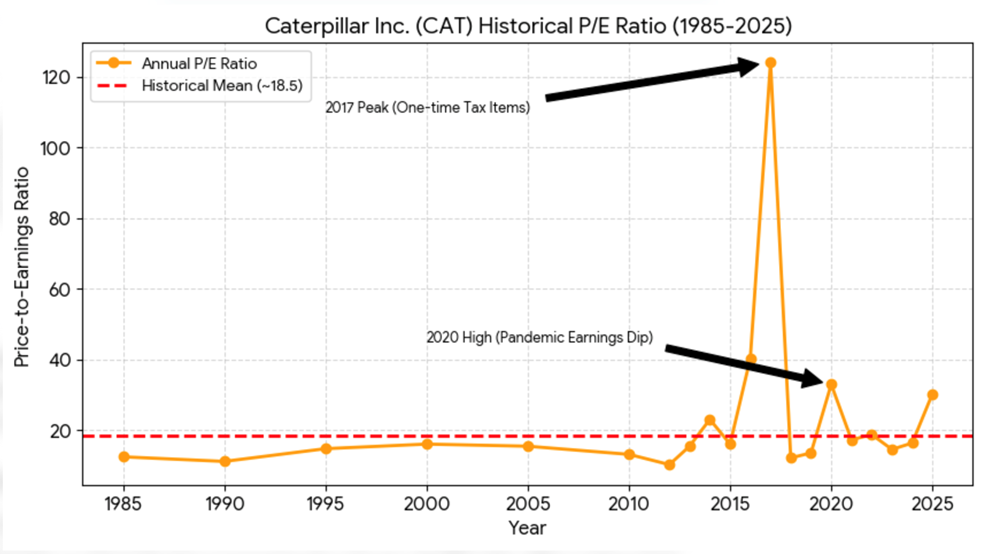
Of course, PE ratio alone does not control the stock price as the equation is:
Stock Price in $ = corporate earnings per share in $ x PE ratio
Each company will have its own long term mean. For example, here is the same 40 year chart for Chevron showing its long term PE ratio of 15.4.
![]()
OK, Now What Do I Do?
The IRS reported in 2025 US taxpayers lost $23 billion due to stolen tax refunds, affecting 2.4 million people. Can you prevent someone from filing an early tax return in your name and stealing your refund? Yes! But how? Use the new IRS IDENTITY PROTECTION PIN (IP PIN). Here’s how.
Search for “how to get the IRS IP PIN”.
The IRS web site (IRS.gov) should appear. Click on the highlighted “Get an identity protection PIN”.
At the IRS web page, scroll down to the blue box that says, “Get an IP PIN”. Click on the blue box.
Follow the instructions. Sign in or create an account with the new identification process called, “ID.me”. You will need to prove your identity which will be a small hassle but worth the time.
Every January, the IRS will give you a new Identity Protection PIN. The number you get in January 2027 will be for your 2026 return. If you get a number in 2026, it will be for any 2025 returns you have not yet filed. Each January you will either get the new number in the mail, or more likely you will get an email telling you to log into the IRS web site to get your new IP PIN. If married, your spouse will have a different IP PIN than you do after going thru the same process.
Here is where you enter you IP PIN on your tax return. This is a picture of the bottom of page 2 of the IRS Form 1040.
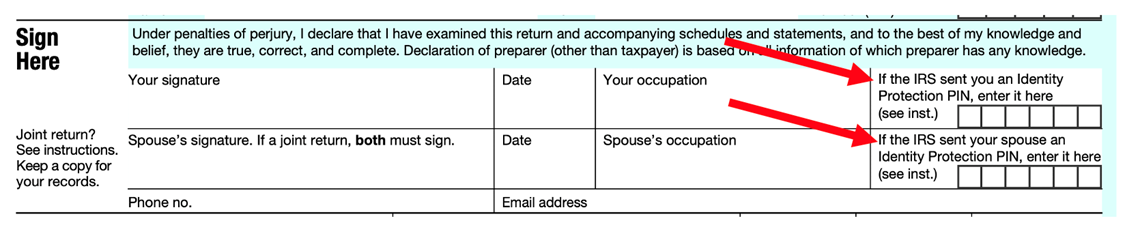
Use your IP PIN on IRS Forms 1040, 1040-SR, 1040-NR, 1040-PR, or 1040-SS.
Fill in your IP PIN as above prior to submitting your tax forms. If you apply and receive an IP PIN but do not list it on your tax return, the IRS will NOT process your return as they will assume it’s a fake!
∙ Not insured by any bank or government ∙ Subject to risk & possible loss of principal
Our Financial Bad Boy This Month
The United States Postal System
On April 3, Mark took a thin padded envelope, 6 by 9 inches, to the West Lafayette Post Office and sent it certified mail to my original hometown, DeSoto, Missouri. DeSoto is about 40 miles south of St. Louis, down I-55. The 6 by 9 envelope only contained a small letter. Using the USPS tracking system, the package was received at the Indianapolis Distribution Center on April 4. OK, that’s a good start.
But then it did not get to the St. Louis Distribution Center until Monday April 20! By Friday of that same week, April 24, it still had not been received at the DeSoto Post Office (only 40 miles away), and much less delivered! Finally, Mark’s package was delivered on April 27. That performance doesn’t even deserve one star.
As we attempt to upgrade our country’s infrastructure, we desperately need a major overhaul of our postal system. And oh, by the way, first-class postage is going up to $0.82 in July from $0.78 today.
It appears we have no oversight from Congress on matters such as this, so that alone justifies Mark saying, “In the November election this year, don’t re-elect anyone!”
• There is no guarantee by any bank or government • Subject to risk & possible loss of principal
The Bond Market
Commentary
On April 29, Chair Jay Powell, held a news conference following the announcement by the Federal Open Market Committee saying they have voted to hold short-term interest rates steady. This was Powell’s last news conference as Chair of the Federal Reserve following the conclusion of his second 4-year term, which ends May 15, 2026.
During the press conference, Chair Powell said, “The economic outlook remains highly uncertain, and the conflict in the Middle East has added to this. Higher energy prices will push up overall inflation. We will continue to monitor the risks to both sides of our dual mandate (maximum employment with stable prices). We are well-positioned to determine the extent and timing of additional adjustments to our policy rate based on the incoming data, the evolving outlook, and the balance of risks. Our monetary policy is not on a preset course. We will make our decisions on a meeting-by-meeting basis.”
The vote was 8 to 4 to hold the federal funds rate in the range of 3.50% to 3.75%. There was one vote to lower short-term rates by 0.25%. There were three members who supported holding rates steady but dissented against the statement’s language, which they felt implied an inappropriate bias towards easing interest rates in the near term.
Chair Powell said he would retain his separate position as a Fed Governor at least until a Justice Department investigation of the central bank and of Powell himself “is well and truly over, with transparency and finality.”
Jay Powell’s chairmanship ends on May 15, 2026. His Fed Governorship term ends on January 31, 2028. President Trump leaves office on January 20, 2029.
Recommended Action for Your Safest Money
Our investor’s safest money recommendations are now listed below and in order with the top line, PRPFX, representing potentially the highest returns, is reasonably safe, but likely will have the highest volatility. This month, we are also adding short-term US corporate high-yield (junk bond) funds as an option for PART of a family’s safe money.
- Permanent Portfolio mutual fund, PRPFX, or gold or silver bullion.
- Short-term U.S. high-yield corporate bond funds.
- Short-term U.S. investment-grade corporate or securitized bond funds.
- FDIC bank or NCUA credit union, 1 to 4 yr CDs, paying at least 4.0%.
- Bank or brokerage-house, high-yield savings or money market accounts, 4.0% min.
- US Treasury Bills of 1 year, or Treasury Notes of 2, 3 or 4 years.
- U.S. Savings I-Bonds which have a max contribution of $10,000 per account per year, are tax deferred for 30 years, do not drop in value like bonds drop in value when interest rates rise, interest is paid and compounded monthly, and the interest rate resets every six months based on inflation (the higher the inflation, the higher the interest rate).
The bottom option in the list above, U.S. Savings I-Bonds, are the most credit safe and have the lowest volatility but potentially the lowest returns. These seven safe money ideas above are in order with the highest volatility item on top and the lowest volatility item on the bottom. We recommend everyone spread their “safe money” over at least five of the seven ideas above.
Due to the low return of all these investment products, investors should not put 100% or anything close to that, in these products. These products are only for an investor’s safest money or perhaps 5% to 40% of an investor’s total portfolio as based on the investor’s risk profile. These products are mostly credit safe, but they will not provide the growth or income needed to stay ahead of, or even keep up with, taxes plus inflation.
Past performance is not a guarantee of future results.
Pop Quiz Answer
How do governments calculate their country’s personal savings rate? Also, on average, how do saving rates differ between Americans, Europeans, and Japanese?
Answer:
Saving rates of a family are calculated first by taking the gross income and subtracting taxes. This, of course, is “after-tax income”.
Then subtract personal consumption of goods and services; then subtract interest payments and charitable donations. This leaves “personal savings”. The savings rate in percent is calculated by dividing personal savings $ by after-tax income $.
As you might have guessed, we Americans are the most meager savers in the developed world.
Mark’s conclusion is, as a society, we are not saving enough. Why not? Mark believes because Americans have not received a sufficient personal financial education. Whose job is it to educate our young people? Answer: our school systems and parents.
Thirty states currently require at least one semester of a personal finance class to graduate high school. This sounds encouraging, but for example, this class, though eventually required in California, is not required there until the graduating class of 2031. Good job Governor Newsom weaning young adults off government assistance! But of course, that is not what progressives want.
Perhaps one semester is not enough. For good, long-term money management within a family, financial education is probably needed over multiple years. Perhaps begin in the 6th grade with some of the basics, then some budgeting tools and understanding compound interest in the 9th grade. And finally, credit and investing do’s and don’ts in the 12th grade.