


Welcome to the September 2026 Newsletter. This month, we’re discussing the economy, employment, financial terminology, and more.
Summary
THE ECONOMY
On the good side, well there was no good economic data released in the past month. On the mediocre side, employment was negative, inflation was flat and not down, Gross Domestic Product was barely OK at 1.5% in the second quarter, mortgage rates were up again, and labor productivity for the first six months of the year was a dismal 0.85%. Fortunately, there is no recession in sight. The economy is showing a yellow light.
THE STOCK MARKET
The S&P 500 Index had its all-time closing high at 7,798.99 on August 13, 2026 due to very high corporate profits and momentum within the tech sector. On July 29, the S&P 500 Index hit a closing low at 7,316.15. That appears to have been our near-term low water mark. If so, the bull market might be resuming its upward trend, but a 10% or more correction could occur at any time. When, not if, that happens, everyone needs to hold on tight to their patience and courage and ride out the downturn. This month, we are suggesting the stock market continues to show a yellow light.
Quote of the Day
Charles P. Kindleberger (1912 to 2013) was an MIT economics professor and a key architect of the Marshall Plan following WWII.
In his book, Manias, Panics, and Crashes, Kindleberger explained the psychology behind speculative stock markets. His book, first published in 1978, shows how individual judgement is clouded by social comparison, leading people to abandon financial fundamentals just to keep up with their peers.
Kindleberger’s book is currently available as the 8th edition as updated in 2023. Leading economists added chapters after his death. The current edition includes analysis of the 2008 Financial Crisis, crypto, and the recent Chinese real estate bubble.

2nd Quote of the Day
A sign in a Florida coffee shop says, “Drink coffee and do stupid stuff faster!”

Pop Quiz
Which US companies have a Standard & Poor’s AAA rating for outstanding creditworthiness?
The answer to this month’s Pop Quiz is at the bottom of the newsletter.
The Economy
Employment
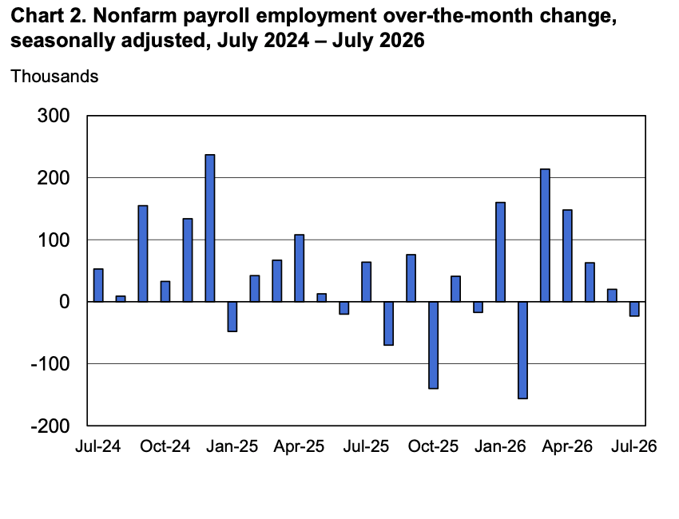
Total U.S. nonfarm payroll employment decreased by 23,000 in July. The official unemployment rate, U-3, decreased slightly to 4.1%. The May and June 2026 combined employment numbers were revised lower by 103,000 than previously reported. These numbers, though disappointing, are only two consecutive months’ worth of undesirable data.
Chart 1 is based on the Bureau of Labor Statistics official unemployment rate, U-3.
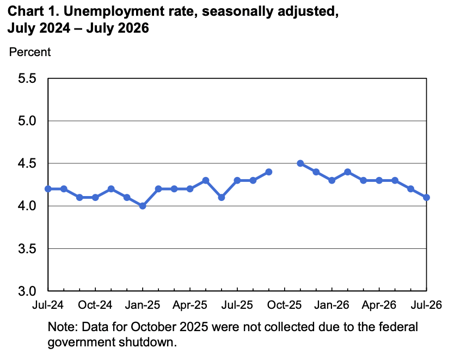
Chart 2 shows the two-year trend of employment growth.
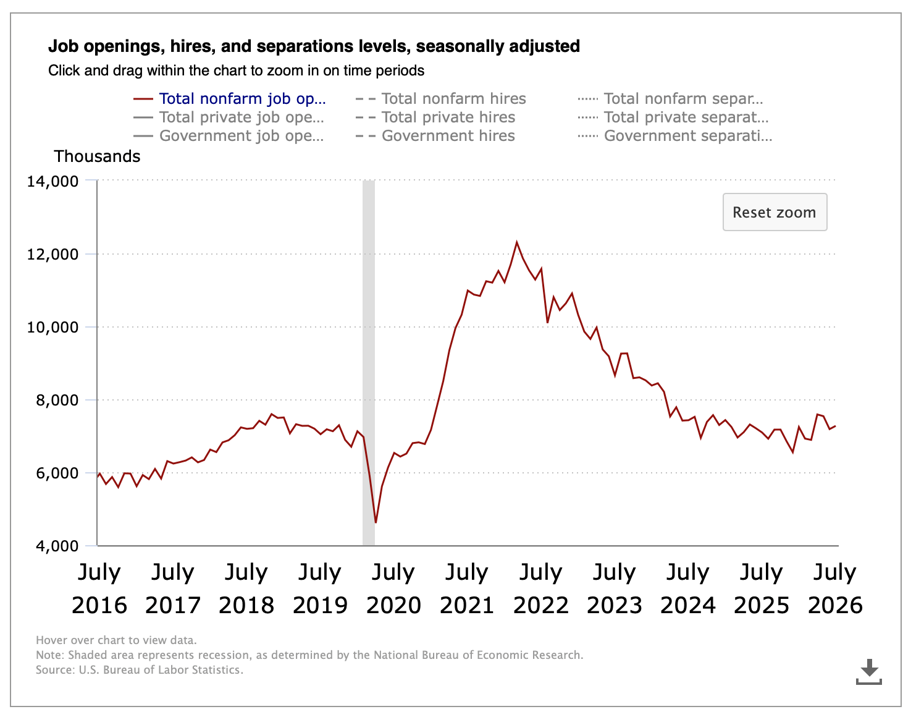
The Job Openings & Labor Turnover Survey (JOLTS) was little changed, at 7.3 million open jobs across the country as of July. It was 7.5 million in June.
The 10-year chart below shows the downward trend in open jobs since the peak in March 2022, but we might be seeing a healthy uptrend beginning over the previous few months.
The seasonally adjusted Total U.S. Unemployment Rate, U-6, remained the same at 7.9% in July as compared to June. There were 7.4 million people unemployed in July, age 16 and older. In June, it was 7.5 million people unemployed.
July Unemployment Rates by Education Level
Average hourly earnings of all employees on private nonfarm payrolls were up 3.2% in July compared to a year ago. It was up 3.5% in June.
| Less Than High School Diploma | 5.4% |
| High School Graduate, No College | 4.0% |
| Some College, Associate's Degree, or Skilled Trade Degree | 3.6% |
| Bachelor's Degree or Higher | 2.7% |
Gross Domestic Product (GDP)
The Bureau of Economic Analysis said the second estimate for GDP in the second quarter of 2026 increased at an annual real rate of 1.5%.
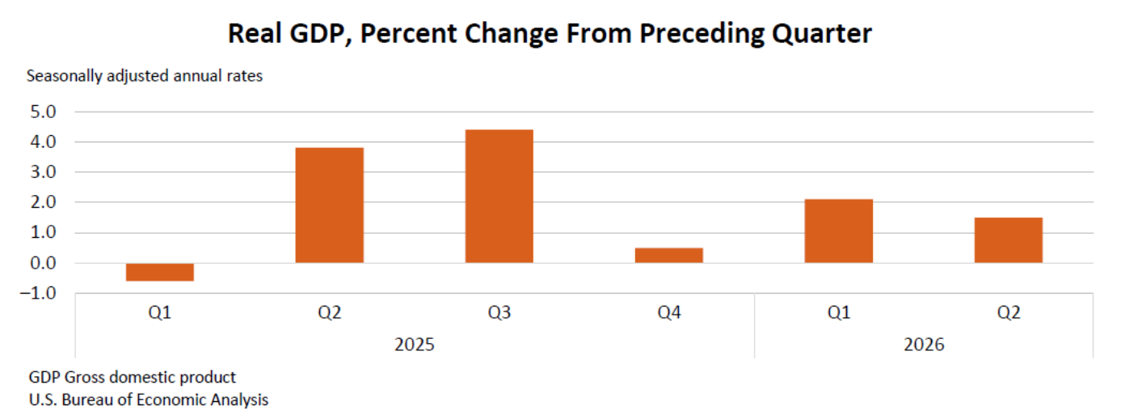
The increase in the second quarter GDP reflected an increase in consumer spending, investment, and exports. These increases were offset by an increase in imports. Imports are a subtraction in the GDP calculation.
Leading Economic Indicators (LEI) sponsored by The Conference Board
The LEI increased by 0.2% in July after decreasing 0.2% in June. The Conference Board’s spokesperson said, “With the most recent gains, the LEI’s six-month growth rate turned positive for the first time in more than four years, suggesting moderate growth ahead.”
The 4-Week Moving Average of Initial Unemployment Claims
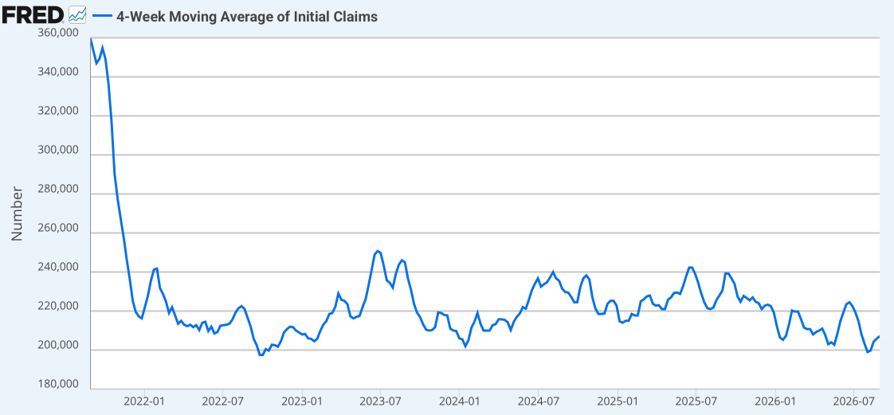
The week of Sept 3 found initial nation-wide unemployment claims had increased slightly to 207,250. See the 5-year chart below from the St. Louis Federal Reserve Bank. A reading of 350,000 to 375,000 indicates an approaching recession, but we are no-where near those levels.
Labor Productivity – Quarterly Releases Only
Annualized and seasonally adjusted, nonfarm labor productivity increased +1.4% in the second quarter of 2026, as released by the Bureau of Labor Statistics. With the first-quarter data being revised substantially down to 0.3%, the annualized rate of labor productivity for the first half of 2026 was a pitiful 0.85%. For the previous 10 years, annual labor productivity increased by an average of 1.9%.
Inflation
Annual inflation remained the same at 3.7% in July as measured by the Personal Consumption Expenditures (PCE) price index. The revised annual June number was also 3.7%. The annual core PCE price index, which excludes food and energy, remained the same at 3.3% in July, as it was in June.
University of Michigan Consumer Sentiment
Consumer sentiment in August decreased to 51.7 compared to July’s revised 55.2. See the 10-year chart below.
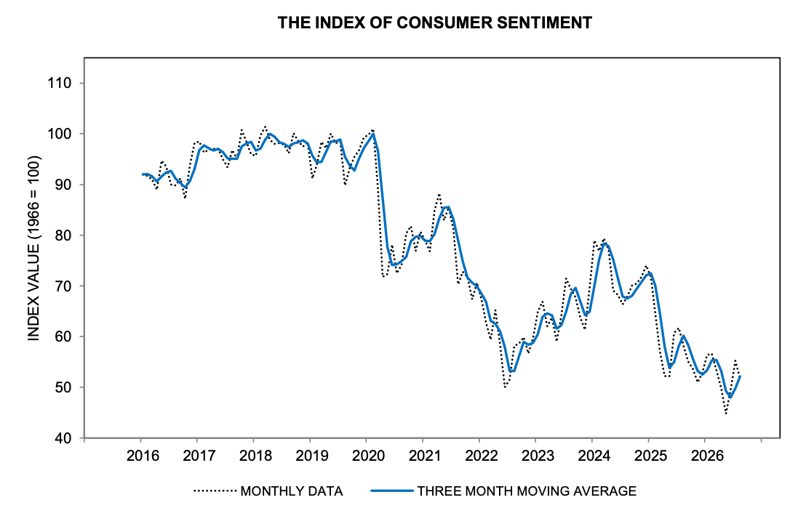
With ongoing policy uncertainty, including the Iran conflict, consumers anticipate further increases in the price of gasoline. In addition to the pocketbook issues that have been central to consumers’ views of the economy, they are increasingly worried that prospects elsewhere in the economy could be weakening.
Mortgage Rates and Average Existing Home Prices
As of August 31, 2026, the average 30-year fixed-rate mortgage had an interest rate of 6.87% compared to 6.77% last month. The average 15-year fixed-rate mortgage had an interest rate of 6.38%, compared to 6.31% in the previous month.
The median existing single-family home sale price increased in July 2026 to $440,300. That was up 0.8% compared to 12 months earlier. The seasonally adjusted annual rate of existing home sales was up 0.7% compared to a year earlier, according to the National Association of Realtors. The inventory of existing homes for sale decreased by 0.6% compared to July 2025. This represents a 4.6-month supply of homes for sale.
The U.S. National Debt as Issued by the Treasury Department as of August 31, 2026, was:
$40,100,000,000,000.
Last month, it was $39,709,000,000,000.
THE STOCK MARKET
Stock Market Commentary
Is the current US stock bull market in 2026 the same or different than the bull market in 2024? It is very different, and here is how.
In 2024, the market was all about:
- The Magnificent 7 stocks (Alphabet, Amazon, Apple, Meta, Microsoft, Nvidia, and Tesla).
- PE ratio expansion (trailing PE ratios grew from 25 to over 28 for the S&P 500).
- The S&P 500 cap-weighted index grew much faster than the equal-weighted version.
- VOO (cap-weighted) up 24.98%
- RSP (equal-weighted) up 12.78%
In 2026, the market is all about:
- Massive corporate earnings expansion.
- PE ratio compression, not expansion.
- Stock prices increasing within every sector, not just a tech story.
- The equal-weighted index is exceeding the performance YTD (through September 4) of the cap-weighted index.
- VOO (cap-weighted) up 13.59%
- RSP (equal-weighted) up 15.25%
Stock Market Valuation
On August 12, 2026, Ed Yardeni, President of Yardeni Research with a PhD in economics from Yale, raised his 2026 year-end forecast for the S&P 500 Index from 8,250 to 8,400.
Here are some other banks and brokerage houses' S&P 500 Index projections for year-end 2026.
- UBS: 8100
- Oppenheimer: 8100
- Citi: 8100
- JPMorgan: 8000
- Goldman Sachs: 8000
- Morgan Stanley: 8000
- Deutsche Bank: 8000
- Wells Fargo: 7900
Evercore also announced its prediction that the S&P 500 Index should attain 9,000 in the next 12 months.
The S&P 500 Index closed on August 31, 2026, at 7,686.14. Through August 31, the Index, as per the exchange-traded fund VOO, is up 12.19%. This ETF includes dividends.
- Markets are volatile · Always consult your financial advisor before investing
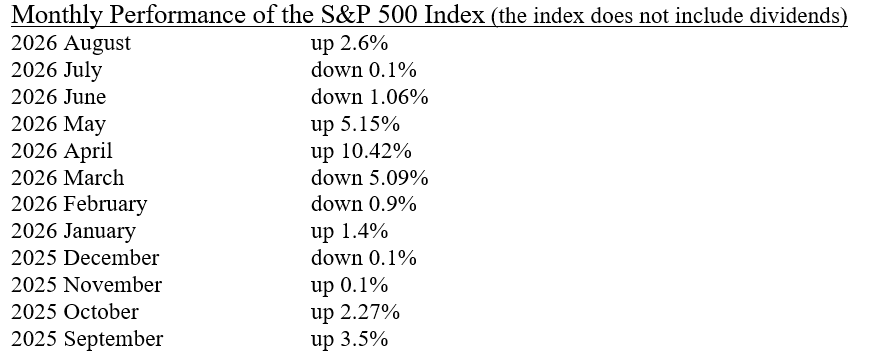
Annual S&P 500 Performance As Per The Exchange Traded Fund, VOO
2025: +17.82%
2024:+24.98%
2023: +26.32%
2022: -18.19%
2021: +28.78%
2020: +18.29%
2019: +31.35%
Recommended Action for Your Stock Portfolio
We have made a variety of stock and ETF recommendations over the past year in this space. But one we made that has not worked out is investing in home builders. A diversified way to invest in this space is to buy the ETF, ITB. But this security has lost 11% in the past 12 months. With this country short 5 to 6 million new homes, why is the stock price of ITB and home builders down? Because mortgage rates are too high to stimulate buyers to buy or sellers to sell.
Stephanie Link said on CNBC during August, “Until fixed-rate 30-year mortgage interest rates decrease to at least 5.5%, new home building will be sluggish.” Link said she sold out of her home builder holdings earlier in August.
If an investor owns one or more home builder stocks such as D.R. Horton, Lennar Corp, PulteGroup, or Toll Brothers, or the ETF, ITB, we recommend selling and investing the proceeds elsewhere.
∙ Not FDIC Insured ∙ No Bank Guarantee ∙ May Lose Value
Financial Markets Vocabulary
This month we are reviewing how the extremely high national debts of the major countries around the world are spending record amounts of money, which requires each country to issue more and more new bonds. This is the major reason interest rates are rising – the massive overabundance of bonds for sale.
Ed Yardeni said on August 17, 2026, “The bond vigilantes are stirring”. Yardeni suggests “bond vigilantes” are individuals and institutions that demand higher and higher yields before buying additional bonds.
Mark Newton, chief technician at Fundstrat said in August, “As bond yields rise and existing bond prices drop, the rate sensitive stocks groups to be hit first with lower stock prices will be utility stocks and REITS.”
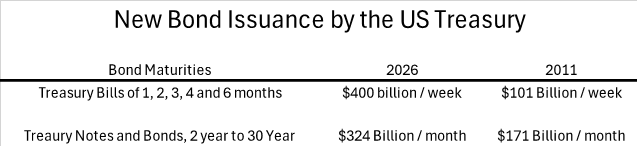
So, with the US national debt now at $40 trillion, the Treasury must issue more and more bonds. The chart below shows the tremendous increase in US debt issuance since 2011.
Dramatic government borrowing is not just a US problem but also exists in the UK, Japan, Germany, France, and Italy. So, how is this high spending and high government borrowing affecting interest rates in 2026 of each country’s sovereign debt? See below.
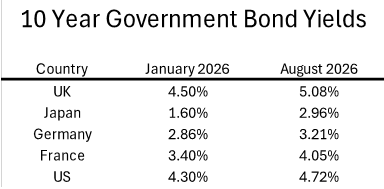
As bond yields go up, the price of existing bonds goes down. A holder of the above sovereign debt has LOST 4 to 7% so far this year due to bond price depreciation. This is due to the mathematical fact that when bond yields are rising, the price of existing bonds decreases!
Can governments just keep spending and borrowing with no long-term consequences to our economy? We do not think so. The end is likely to be economically traumatic due to massive cuts in federal spending and very high interest rates for a very long time.
OK, Now What Do I Do?
Recently, a married 70-year-old couple has unexpectedly come into $100,000 and asked Mark for his investment advice for this new money. Knowing this couple has a very low risk tolerance, Lorenz Financial made the following recommendations in this specific sequence:
- Pay off all bad debt. All debt is bad debt except a conventional, fixed-rate, first mortgage on their primary residence.
- Increase the family’s emergency plan to 3 to 6 months of family expenses. A conservative investor such as this couple might want to have a full 6-month emergency fund.
- Hire an in-state estate planning lawyer to prepare the five documents below that everyone over the age of 18 should have. For a married couple, this is 10 documents total.
- Will
- Durable Power of Attorney
- Health Care Power of Attorney
- Living Will, also called Health Care Directive
- HIPAA Release
- If working, fully fund a Roth IRA for you and your spouse (only one needs to have earned income to have two IRAs). Also fully fund an employer’s retirement plan this year.
- OPTIONAL: Set aside money for kids’ college, weddings, etc., or gifts to children. 2026 gifts to children (or anyone) are a maximum of $19,000 per person per year, are not taxed as income for the recipient, and no tax or fee is placed on the giver.
- OPTIONAL: Pay off or pay down the home mortgage by recasting the mortgage or refinancing it with an equity contribution.
- OPTIONAL: Take a $10,000 vacation to Europe.
- Invest the rest by putting 40% into the safe money ideas at the bottom of this newsletter and 60% into VOO, Vanguard’s S&P 500 Index ETF in a taxable brokerage account. This fund has not had any capital gain distributions in the past couple of decades. The only taxable distribution this fund has had each year is approximately a 1% distribution of dividends.
Point 8 may not appear to be a conservative investment strategy, but we are assuming a 70 year old is likely to live another 20 to 35 years. As inflation is a silent destroyer of wealth, a good part of a person’s wealth needs to be invested beyond savings to enable growth even after paying taxes and suffering inflation.
• Not insured by any bank or government • Subject to risk & possible loss of principal
OUR FINANCIAL BAD BOY THIS MONTH
This month, our bad boy is our very old national electrical grid.
Transmission Lines: Approximately 70% of transmission and distribution lines are in the second half of their expected 50-year lifespan. Some analysts have concluded 31% of our transmission lines are beyond their useful life.
Large Power Transformers (LPT): LPT’s are typically 20 feet high, 20 feet wide, and 30 feet long. 65% of large power transformers are older than 25 years. The average age of these units is approximately 40 years, which is their designed life expectancy. As each one of these transformers is highly unique, there are no warehouses full of these massive components. When one fails, a spec is written and a new transformer is ordered. The current wait time for a new large power transformer is 2.5 to 3 years. The much smaller transformers seen on utility poles are in plentiful supply.
Substations: Much of the core substation equipment was built between 50 and 75 years ago. Approximately 60% of circuit breakers are over 30 years old.
Our conclusion is, even without the huge new electrical demand from AI data centers, our electrical grid needs massive amounts of investment with new equipment – meaning electrical rates will be going up.
Of course it’s not the grid’s fault. We place the blame on some of our electrical utilities and most of the blame on our state Public Service Commissions that regulate the utilities. This is just another example of a government agency failing to act in the public’s best long-term interest.
• There is no guarantee by any bank or government • Subject to risk & possible loss of principal
The Bond Market
Commentary
As bond interest rates are very much a function of inflation, we have a discussion below on inflation from Rebecca Patterson, Senior Fellow at the Council on Foreign Relations.
On Aug 13, Patterson said, “There is demand-driven inflation that the Federal Reserve can easily address by raising interest rates. But within every economy there is the potential of supply-driven inflation. This second type of inflation is almost impossible for the Fed to address. Supply-driven inflation, as you can see below, needs to be addressed by Congress, and neither political party seems inclined to pursue any action. Unfortunately, in the US today, we have supply-driven inflation. Examples today of this type of inflation are:
- Due to retirements of boomers, lower immigration, and lower birth rates for decades, we do not have enough workers to fully support our increasing GDP. This drives inflation due to higher labor costs.
- We don’t have enough housing, so home prices are higher than they should be. 80% of home mortgages are under 4%, which discourages homeowners from moving,
- The supply of electrical energy has not kept up with demand. Therefore, rates are higher than they should be.
- The whole world has a shortage of efficient commercial aircraft. Boeing’s backlog is 6,200 planes, and Airbus's backlog is 9,350. Air fares are therefore higher due to insufficient competition of aircraft manufacturers, and too many inefficient planes are still flying.
- Water shortages out west will lead to higher food prices due to lower food production.
- On a worldwide basis, there is an oil and natural gas shortage and lack of efficient distribution due to Middle East terrorism.
- Computer and phone memory chip prices are up 450% in the past 12 months due to shortages created by the tremendous memory chip demand of AI.
Therefore, we believe inflation and interest rates are going to remain stubbornly high for a long time.
Recommended Action for Your Safest Money
Our investor’s safe money recommendations are listed below and in order, with the top line, PRPFX, representing potentially the highest returns, is reasonably safe, but likely will have the highest volatility.
- Permanent Portfolio mutual fund, PRPFX, or gold or silver bullion.
- Short-term, U.S. high-yield, corporate, junk bond funds, like FLHY.
- Short-term, U.S. investment-grade, corporate & securitized bond funds, like JPLD.
- Ultra-Short-term, U.S. investment-grade, corporate bond funds, like PULS.
- US Treasury Bills of 1 year, or Treasury Notes of 2, 3, 4, or 5 years, 4.1% to 4.5%.
- Bank high-yield savings or brokerage house money market accounts 3.60% min.
- FDIC bank or NCUA credit union, 1 to 5 yr, non-callable CDs, yielding 4.1 to 4.5%.
- U.S. Savings I-Bonds which have a max contribution of $10,000 per account per year, are tax deferred for 30 years, do not drop in value like bonds drop in value when interest rates rise, interest is paid and compounded monthly, and the interest rate resets every six months based on inflation (the higher the inflation, the higher the interest rate).
The bottom option in the list above, U.S. Savings I-Bonds, are the most credit safe and have the lowest volatility but potentially the lowest returns. These eight safe money ideas above are in order with the highest volatility item on top and the lowest volatility item on the bottom. We recommend everyone spread their “safe money” over at least five of the eight ideas above.
Due to the low return of these investment products, investors should not put 100% or anything close to that in these products. These products are only for an investor’s safest money or perhaps 5% to 40% of an investor’s total portfolio, based on the investor’s risk profile. These products are mostly credit safe, but they will not provide the growth or income needed to stay ahead of, or even keep up with, taxes plus inflation.
Past performance is not a guarantee of future results.
Pop Quiz Answer
Which US companies have a Standard & Poor’s AAA rating for outstanding creditworthiness?
Answer:
There are only two US companies with an AAA credit rating. They are:
- Microsoft (MSFT)
- Johnson & Johnson (JNJ)