


Welcome to the August 2026 Newsletter. This month, we’re discussing the economy, employment, financial terminology, and more.
Summary
THE ECONOMY
On the good side, June unemployment was down, and PCE core inflation was also lower at 3.7%. On the mediocre side, GDP was barely okay at 1.5% in the second quarter, and mortgage rates were up again. Fortunately, there is no recession in sight. The economy is showing a green light.
THE STOCK MARKET
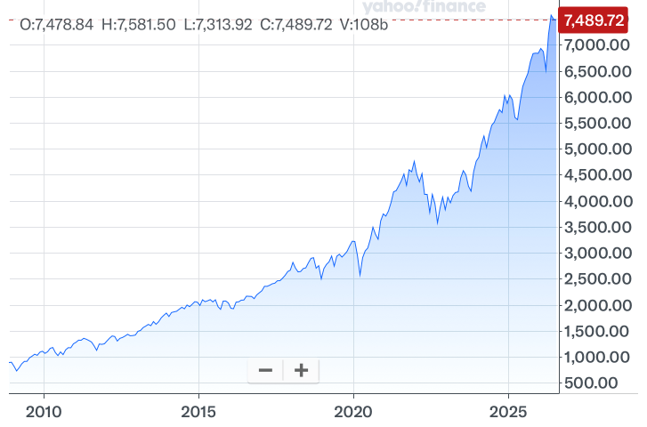
The stock market had its all-time closing high at 7,609.78 on June 2, 2026 due to very high corporate profits and momentum within the tech sector. June 2 seems a long time ago. Since then, the market, and especially the tech sector, has had a significant reversal to the downside. Yes, July 30 and 31 were up, so we might have hit bottom. If so, the bull market might be resuming its upward trend. But this month we are suggesting the stock market is showing a yellow light. We have more stock market information in the newsletter below.
Quote of the Day
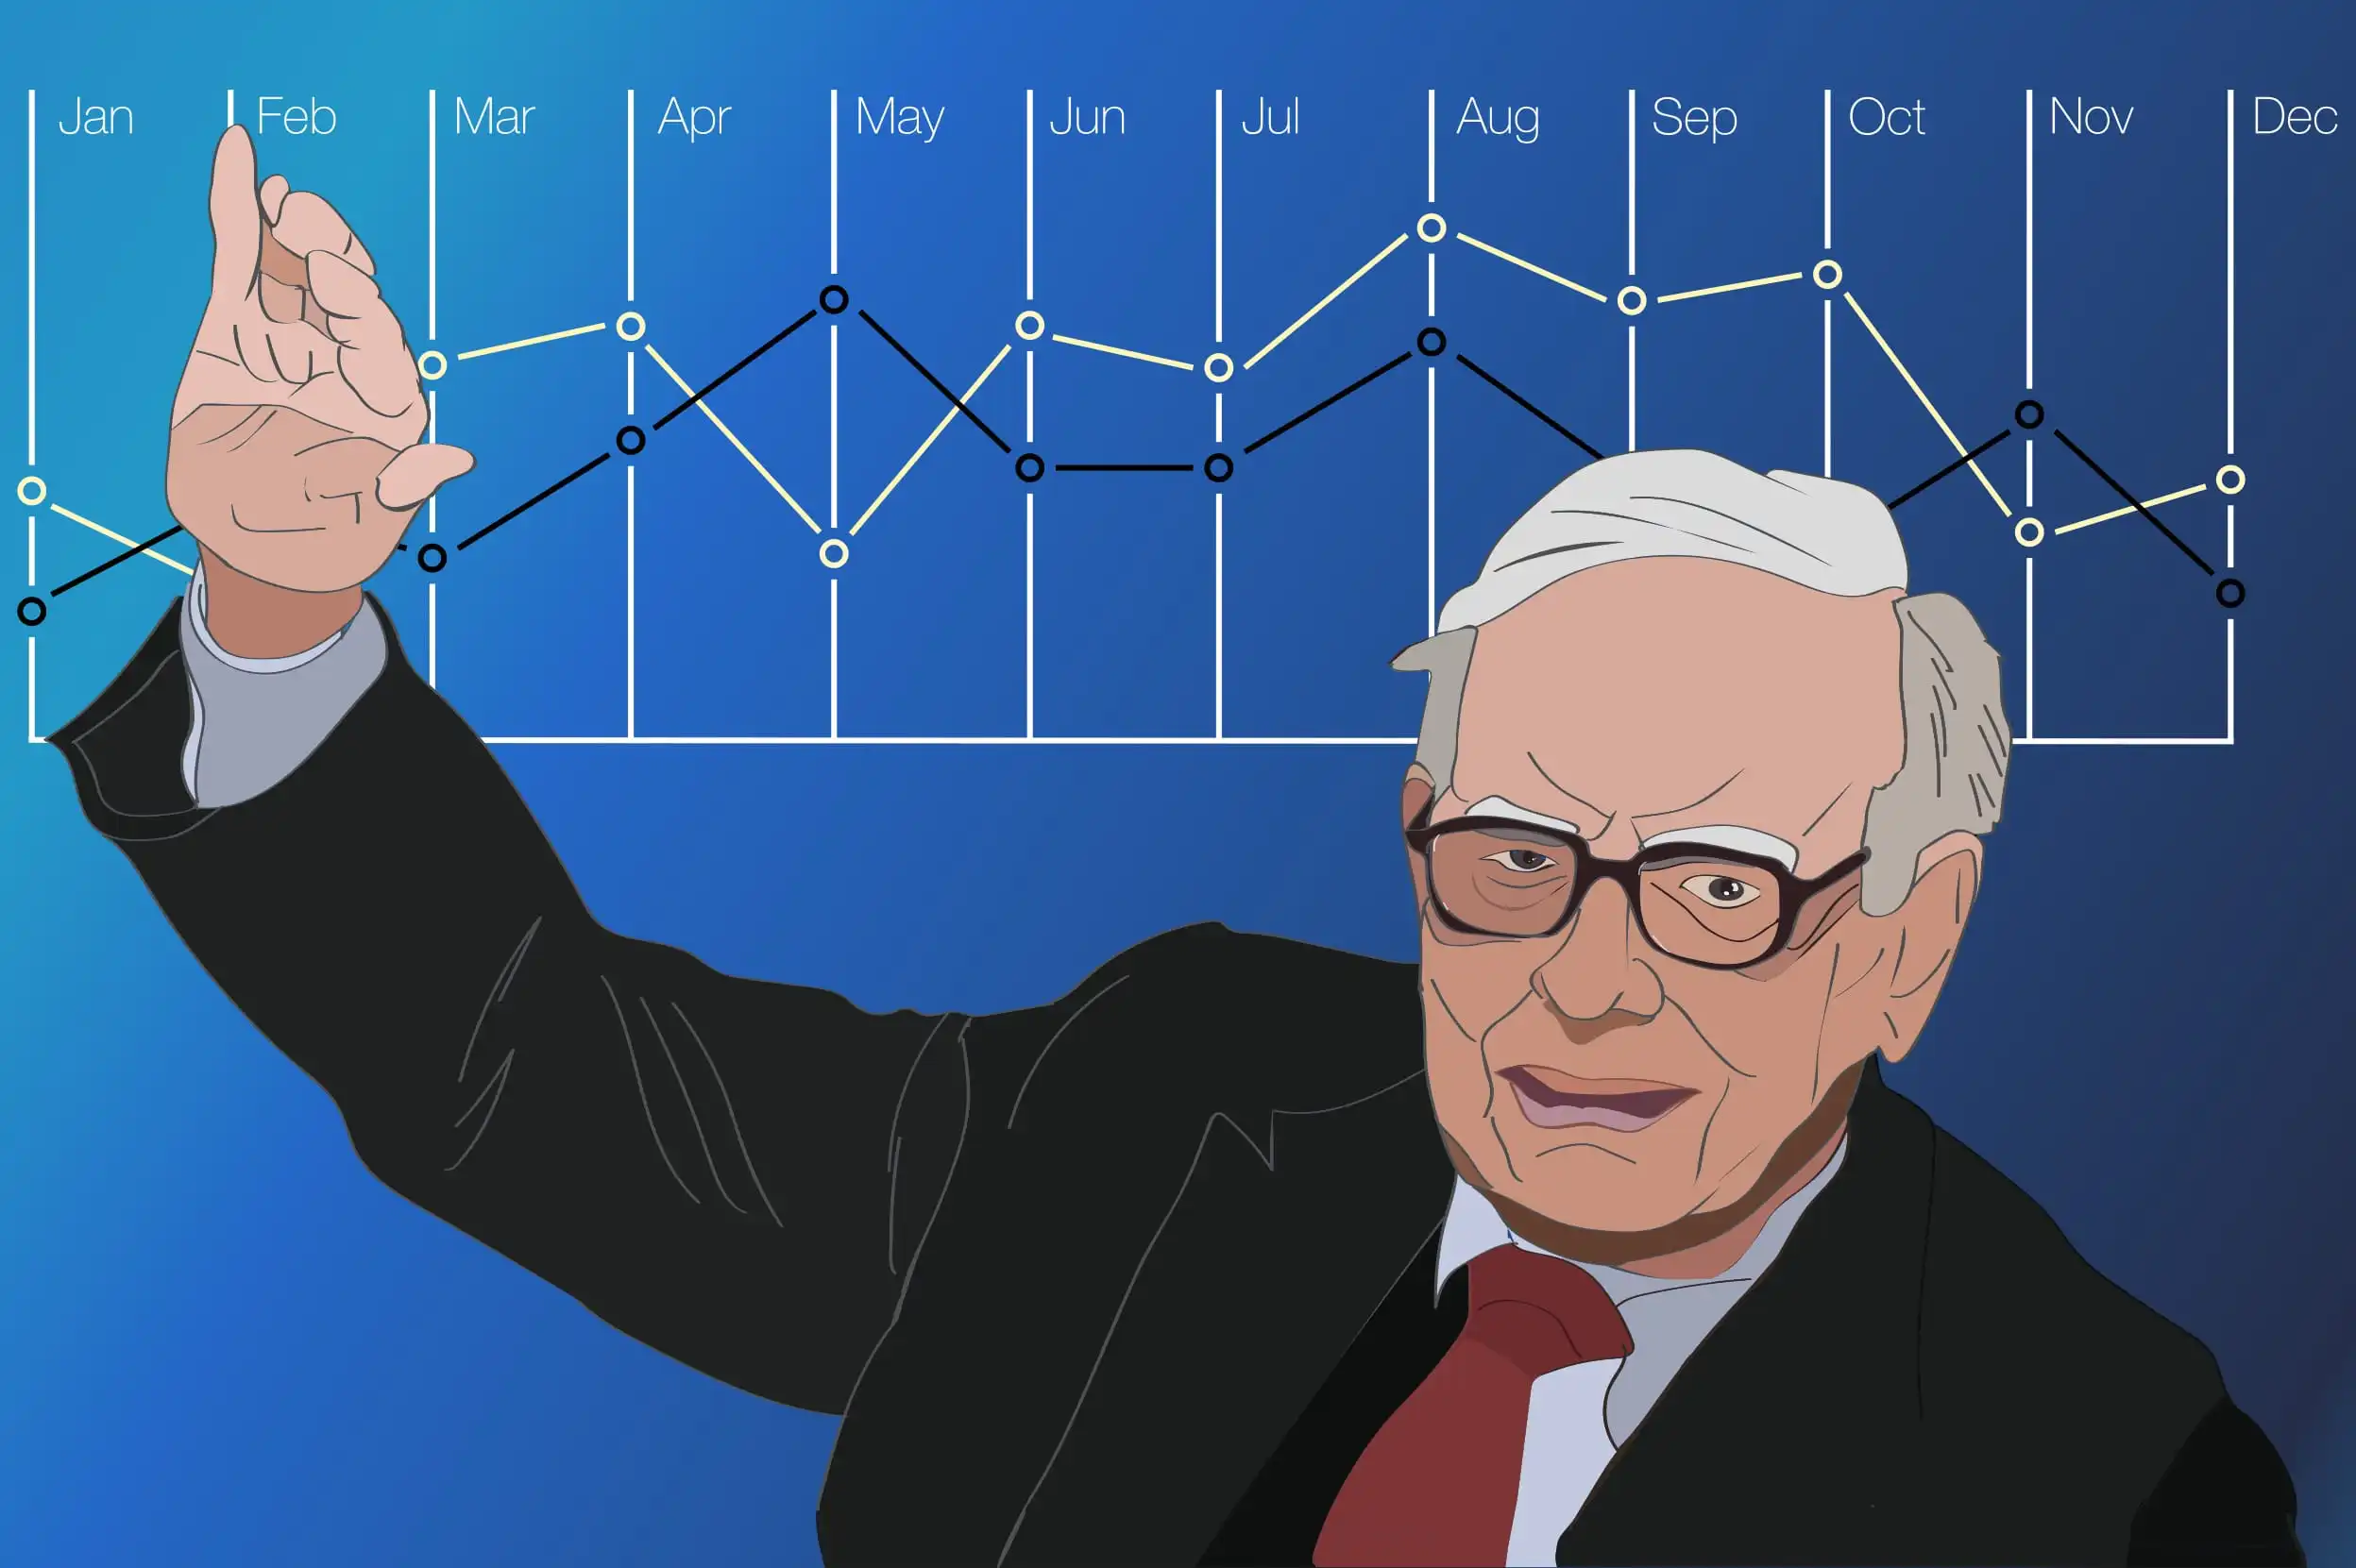
This month we have two quotes from Warren Buffett.
Buffett said, “In looking at people to hire, you need to look at three qualities: integrity, intelligence, and energy (or work ethic). If the candidate does not have the first one, the other two will kill you.”
On a different day, Buffett said, “Price is what you pay. Value is what you get.” In other words, the value of a product or service cannot be determined just by its price. For example, an $18 pair and an $80 pair of blue jeans might both offer great or terrible value. Price does not determine value!
Pop Quiz
After all employees are paid a fair and competitive wage, all the company’s suppliers are paid, all payments on the company’s debt are paid, all taxes are paid, current dividends are paid to all stockholders, and all other accounts payable are paid, what remains is the company’s profit. What are the six options a company has regarding how to utilize those profits?
The answer to this month’s Pop Quiz is at the bottom of the newsletter.
The Economy
Employment
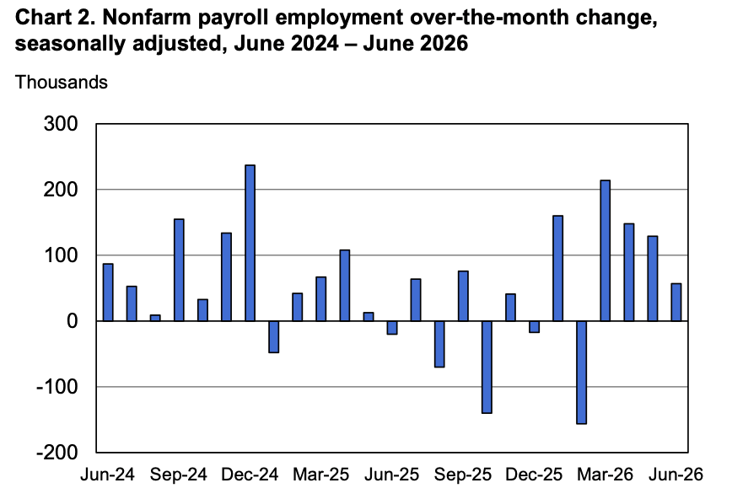
Total U.S. nonfarm payroll employment increased by only 57,000 in June. The official unemployment rate, U-3, decreased slightly to 4.2%. The April and May 2026 combined employment numbers were revised lower by 74,000 than previously reported. These numbers, though disappointing, are only one month’s worth of undesirable data.
Chart 1 is based on the Bureau of Labor Statistics official unemployment rate, U-3.
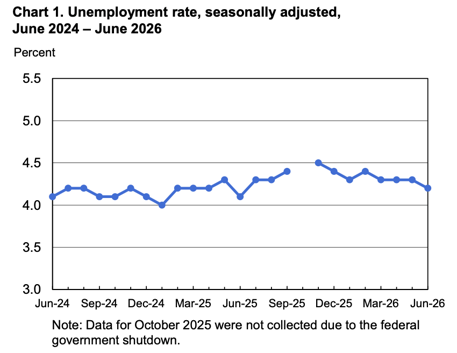
Chart 2 shows the two-year trend of employment growth.
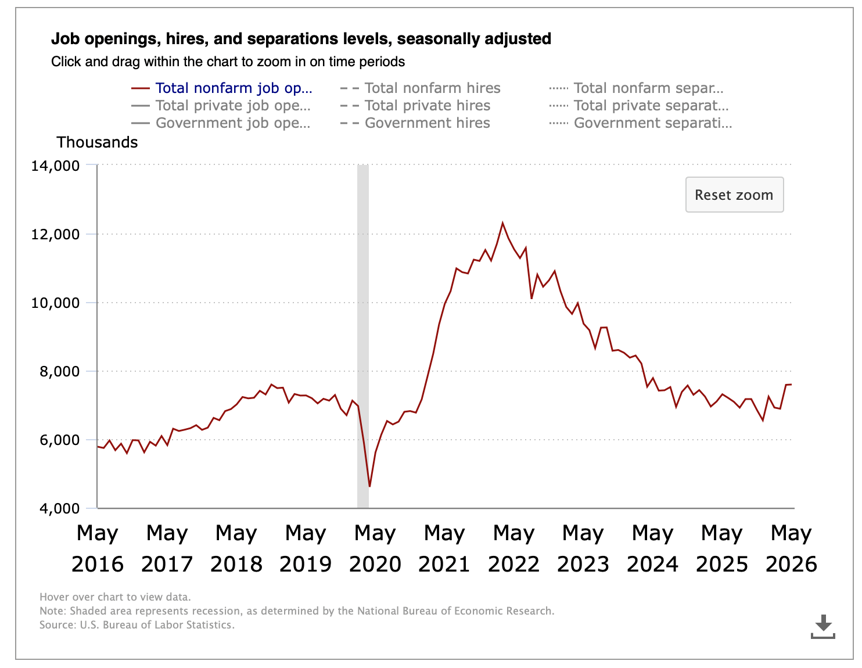
The Job Openings & Labor Turnover Survey (JOLTS) was unchanged at 7.6 million open jobs across the country as of the last business day in May. It was 6.9 million in March. An increasing open jobs number is a positive sign the economy is in a good place.
The 10-year chart below shows the downward trend in open jobs since the peak in March 2022, but we might be seeing a healthy uptrend beginning.
The seasonally adjusted Total U.S. Unemployment Rate, U-6, decreased to 7.9% in June as compared to 8.1% in May. There were 7.5 million people unemployed in June, age 16 and older. In May, it was 6.9 million people unemployed. An increasing number of unemployed people looking for work is a good sign as this occurs when the economy is improving.
June Unemployment Rates by Education Level
Average hourly earnings of all employees on private nonfarm payrolls were up 3.5% in June compared to a year ago. It was up 3.4% in May.
| Less Than High School Diploma | 5.5% |
| High School Graduate, No College | 4.2% |
| Some College, Associate's Degree, or Skilled Trade Degree | 3.6% |
| Bachelor's Degree or Higher | 2.7% |
Gross Domestic Product (GDP)
The Bureau of Economic Analysis said the advance estimate for GDP in the second quarter of 2026 increased at an annual real rate of 1.5%.
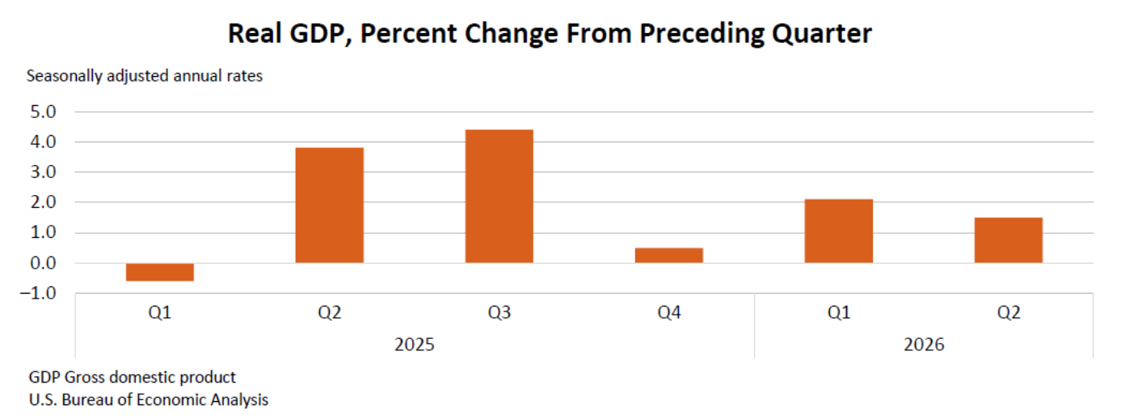
The increase in the second quarter GDP reflected an increase in consumer spending, investment, and exports. These increases were offset by a decrease in imports. Imports are a subtraction in the GDP calculation.
Leading Economic Indicators (LEI) sponsored by The Conference Board
The LEI decreased by 0.2% in June after increasing 0.1% in May. The Conference Board’s spokesperson said, “The largest positive contribution to the LEI in June came from the yield spread, but this was not enough to offset weak consumer expectations and a drop in building permits.”
The 4-Week Moving Average of Initial Unemployment Claims
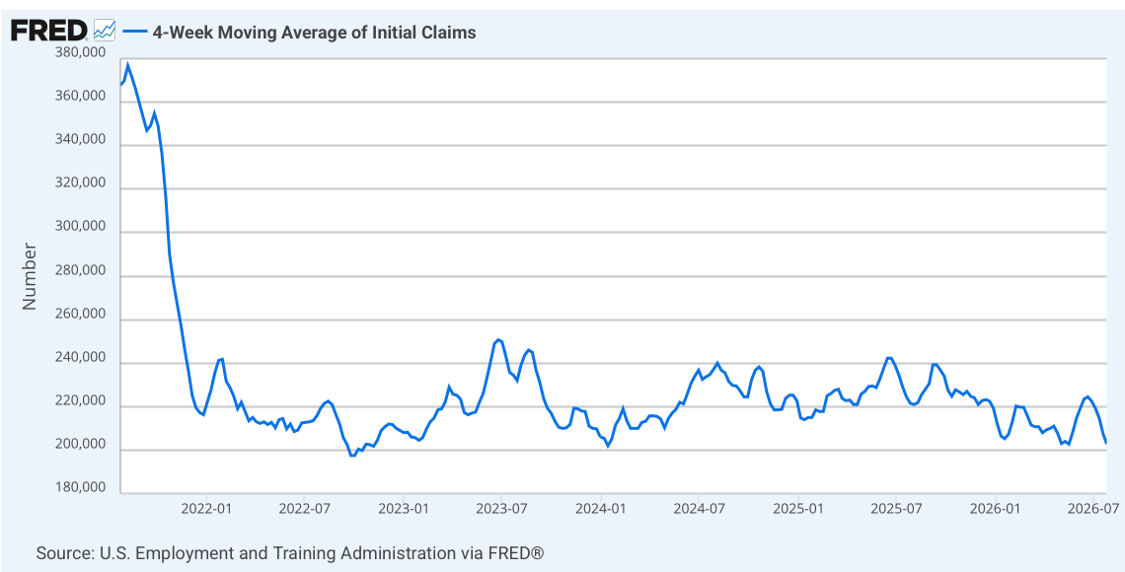
The week of July 30 found initial nationwide unemployment claims had decreased to 202,750. See the 5-year chart below from the St. Louis Federal Reserve Bank. A reading of 350,000 to 375,000 weekly initial unemployment claims would indicate an approaching recession, but we are nowhere near those levels.
Labor Productivity (Quarterly releases only. Second quarter data will be released later in August.)
Annualized and seasonally adjusted nonfarm labor productivity increased dismally by +0.3% in the first quarter of 2026 as released by the Bureau of Labor Statistics. For the previous 10 years, annual labor productivity increased an average of 1.9%.
Inflation
Annual inflation decreased to 3.7% in June as measured by the Personal Consumption Expenditures (PCE) price index. The revised annual May number was 4.1%. The annual core PCE price index, which excludes food and energy, decreased slightly to 3.3% from a revised 3.4% in May.
University of Michigan Consumer Sentiment
Consumer sentiment in July increased to 54.4 compared to June’s revised 49.5. See the 10-year chart below.
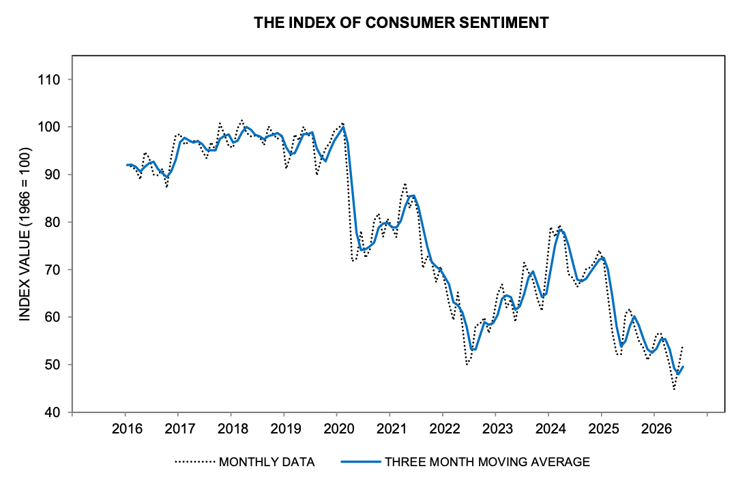
With the second straight month of a 10% jump, consumer sentiment climbed to its highest reading since February of this year on the basis of easing gas pump prices. All five index components improved, led by a significant 20% increase in consumer durables and year-ahead business conditions.
Mortgage Rates and Average Existing Home Prices
As of July 31, 2026, the average 30-year fixed-rate mortgage had an interest rate of 6.77% compared to 6.54% last month. The average 15-year fixed-rate mortgage had an interest rate of 6.31%, compared to 6.12% in the previous month.
The median existing single-family home sale price increased in June 2026 to $446,400. That was up 1.8% compared to 12 months earlier. The seasonally adjusted annual rate of existing home sales was up 3.3% compared to a year earlier, according to the National Association of Realtors. The inventory of existing homes for sale increased by 1.3% compared to June 2025. This represents a 4.6-month supply of homes for sale.
The U.S. National Debt as Issued by the Treasury Department as of July 31, 2026, was:
$39,709,000,000,000.
Last month it was $39,347,000,000,000.
THE STOCK MARKET
Stock Market Valuation
The S&P 500 Index closed on July 31, 2026 at 7,489.72. Year-to-date, the Index, as per the exchange-traded fund, VOO, is up 10.16% . This ETF includes dividends.
- Markets are volatile · Always consult your financial advisor before investing
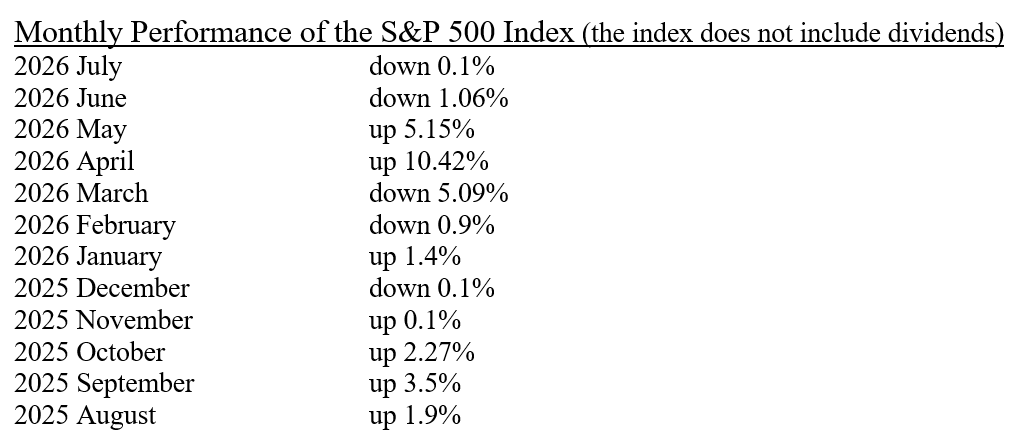
Recent Annual S&P 500 Performance As Per The Exchange Traded Fund, VOO
2025: +17.82%
2024:+24.98%
2023: +26.32%
2022: -18.19%
2021: +28.78%
2020: +18.29%
2019: +31.35%
Recommended Action for Your Stock Portfolio
For stock portfolio comments and recommendations, see the section below, “OK, Now What Do I Do”.
∙ Not FDIC Insured ∙ No Bank Guarantee ∙ May Lose Value
Financial Markets Vocabulary
What are Medicare Parts A, B, C, D, and what are Medigap insurance plans?
Most people sign up for Medicare two to three months before their 65th birthday, as most employers’ insurance will drop coverage on the first of the month in which a person turns 65. If a person signs up for Medicare more than 3 months after the month in which they turn 65, the monthly cost of Medicare will be higher. The sign-up period for Medicare is not just the month of turning 65. It also includes the 3 months before and 3 months after a person’s birthday month.
Medicare Parts A and B pay 80% of the costs approved by Medicare; the patient is responsible for the remainder unless the remainder is covered by a Medigap plan. Parts A and B are often referred to as “original Medicare”.
Medicare Part A is hospital insurance that covers inpatient hospital stays, skilled nursing care, hospice, and limited home health services. It is generally premium-free if you or your spouse paid Medicare taxes for at least 10 years.
Medicare Part B is medical insurance that covers outpatient service, doctor visits, and preventive care. The monthly premium for Part B is $202.90 per month per person in 2026. The price goes up almost every year.
Medicare Part C is also called Medicare Advantage. Part C is offered by private insurance companies approved by the federal government. These plans bundle your Parts A and B and often include Part D. Frequently, extra benefits can be included, such as dental and/or hearing aids, and/or transportation to doctor appointments, etc. These extra benefits are available because the federal government extends additional payments to the insurance companies.
There are four disadvantages of Medicare Part C plans.
- The extra payments currently offered to the insurance companies by the federal government for Part C may stop at any time.
- Many doctors accept patients with Medicare but may not accept patients with a Medicare Advantage Plan.
- Advantage Plans only participate in the medical costs if the doctor, clinic, or hospital is “in-network”. Go outside the insurance company’s network, and the patient is responsible for the whole bill.
- If the patient with an Advantage Plan wants to switch to original Medicare and purchase a Medigap insurance plan, there will be 15 to 20 pages of medical questions to be accepted by the Medigap insurance company. You may be declined.
OK, so what is a Medigap Insurance plan?
Basically, Medigap Insurance, also called a Medicare Supplemental insurance plan, is offered by private insurance companies to pay some or all the costs that Medicare Parts A and B do not cover. This includes the 20% Medicare does not pay. There are 10 separate plans available. Their confusing nomenclature includes plans A, B, C, D, F, G, K, L, M, and N. While the benefits of each letter remain identical regardless of the insurer, not every plan is sold in every state or by every private insurer. So, the decision process includes deciding which plan a person wants (A through N) and then a second decision as to which insurer. Likely, the insurer picked at age 65 will be the insurer for life.
Medicare Part D is an optional, federally approved insurance program run by private insurance companies that covers the cost of outpatient prescription drugs. It is highly recommended! See our example below.
A patient is prescribed one of those new expensive drugs, say $1,200 per month. For the senior citizen with no prescription drug insurance, they will pay $1,200 per month.
For the person with a Part D prescription drug plan, first recognize the insurance company has already negotiated a huge discount with each drug manufacturer. Let’s say the insurance company will pay only $250 per month to the drug company, and not $1,200. The insurance company might then cover $200 of the cost and charge the patient $50 per month. These plans typically have a monthly premium of $10 to $150 depending on which medications each patient takes. This is a whole lot better than $1200 per month! Keep in mind your Part D insurance company may not cover all medications.
Seniors can switch providers of their Medicare Part D prescription drug plan every year if they find a cheaper alternative. To learn more about Medicare before reaching 65, perform an online search for a free Medicare seminar near you.
OK, Now What Do I Do?
This month, we are publishing a variety of bearish (down) comments on the short-term outlook for the stock market. See the 17-year chart below of the S&P 500 Index.
Tom Lee, co-founder and head of research at Fundstrat Global Advisors, has issued a rare caution warning the stock market could shift abruptly and face a drawdown that “feels like a bear market (down 20% or more) between August and October 2026”.
Howard Marks is co-chairman of Oaktree Capital Management and author of a highly rated newsletter. On January 7, 2025 (1.5 years ago), his newsletter was titled, “On Bubble Watch” and showed a very interesting chart as below.
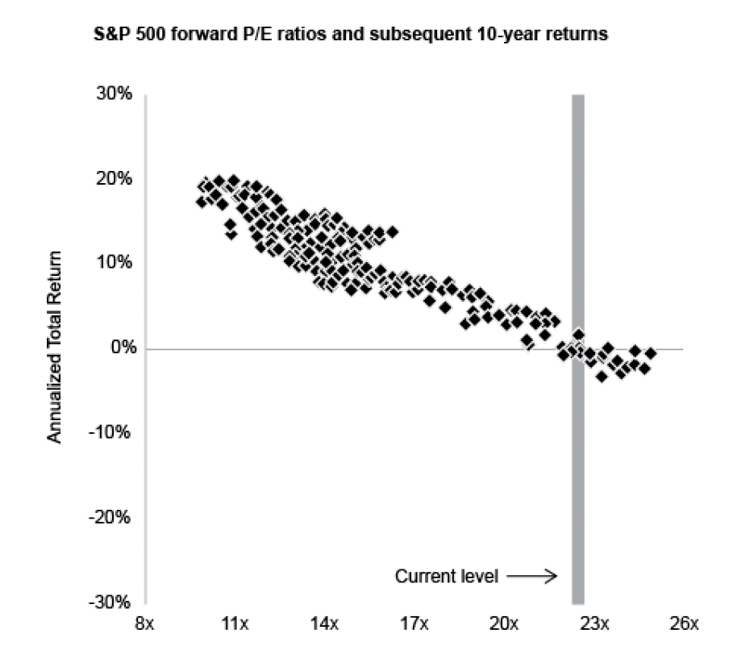
To understand the chart, start with today’s S&P 500 Index PE ratio, which is 20. When Howard Mark’s published this 2025 newsletter, it was nearly 23. So, draw an imaginary vertical line starting on the X-axis at 20. It will intersect the series of dots around 4% or 6% annualized total return over the next 10 years – as per the Y-axis. This suggests the stock market in the next 10 years could give us a return only slightly greater than the rate of inflation – just when we got used to an 18% annual return!
Warren Buffett, Chairman of Berkshire Hathaway, is not explicitly predicting a near-term stock market crash, but his recent behavior and comments warn of extreme caution. This conclusion is based on the following:
- Buffett recently said, “We’ve never had people in a more gambling mood than now.”
- Over the past three years, Berkshire has been a net seller of stocks. This has increased the investment firm’s short-term holdings to $397 billion in cash and short-term treasuries.
- Buffett has created his own macro indicator that divides the aggregate value of the US stock market by the US national GDP. Currently it’s at 245%. Buffett said any reading climbing past 200% represents “playing with fire” and means investors are banking on a suspension of economic gravity!
Robert Shiller is a Yale University professor of Economics and also serves as a fellow at the Yale School of Management. Shiller’s work includes the creation of the Shiller Cyclically Adjusted Price-to-Earnings (CAPE) ratio. This metric looks at the current price of the S&P 500 Index divided by the average earnings of the S&P 500 companies over the past 10 years after adjusting the earnings for inflation.
Historically, this metric’s long-term average is 17 to 17.5. At the start of the 3-year-long Dot-Com bubble from early 2000 to early 2003, the Shiller CAPE Ratio stood at 44.2. Today the Shiller CAPE Ratio is 42.2.
Mid-term election year history, as per Yale Hirsch’s Stock Trader’s Almanac:
- Lower Average Returns – The midterm election year’s average annual return for the S&P 500 has been 7.5% as compared to the other three years’ average returns of 12.4%.
- Severe Intra-Year Corrections – The average intra-year drawdown during a midterm election year is 19%. That is worse than the 13% average drawdown seen in the other three years of a presidential cycle.
On the other hand,
Ed Yardeni, President of Yardeni Research, remains strongly bullish over the intermediate and long-term but maintains a 20% probability for a short-term bearish scenario.
From Lorenz Financial: As always, we at Lorenz Financial are closely watching market events and trading patterns. If conditions worsen after the July announcements of second quarter corporate profits, we will extend a specific recommendation regarding this market. Contact Mark with any questions at mark_lorenz3412@comcast.net or call or text Mark at (765) 532-3295.
∙ Not insured by any bank or government ∙ Subject to risk & possible loss of principal
OUR FINANCIAL GOOD BOY THIS MONTH
The good boy this month is the state of Ohio!
Here are the top 10 states for business in 2026 as per this year’s CNBC business and state survey.
1. Ohio
2. North Carolina
3. Virginia
4. Texas
5. Minnesota
6. Michigan
7. Georgia
8. Florida
9. Tennessee
10. Indiana
Eight out of the top ten states are in the Midwest and Southeast.
• There is no guarantee by any bank or government • Subject to risk & possible loss of principal
The Bond Market
Commentary
On July 29, 2026, the Federal Open Market Committee (FOMC) concluded their two-day meeting and announced they voted to keep their policy rate (the Federal Funds rate) unchanged in the range of 3.50% to 3.75% by a vote of 9 to 3. Three Fed bank presidents voted to raise rates by 0.25% to begin the fight against high inflation. At 2:30 on the same day, Chair Warsh spoke emphatically that the FOMC has only one inflation target and it is 2.0%!
He spoke so emphatically that the crowd of reporters started asking him, "Well then why did the committee fail to raise rates today?" The questions were intentionally pointed and “in his face”.
The conclusion by some observers was that Chair Warsh does not have enough commitment to fight inflation. If he did, the feeling was he needed to “Get in the fight!” and “What are you waiting on!”
Some economists say the moving target for the Federal Funds rate is the 2-year US Treasury, which is now yielding 4.23%. If so, the policy rate-range of 3.50% to 3.75% is not going to get the job done fighting inflation as this rate-range is too low compared to the 2-year Treasury.
Recommended Action for Your Safest Money
Our investor's safe-money recommendations are listed below in order. The top line, PRPFX, represpents the highest returns and is resonably safe—but it will likely have the highest volatility.
- Permanent Portfolio mutual fund, PRPFX, or gold or silver bullion.
- Short-term, U.S. high-yield, corporate, junk bond funds, like FLHY.
- Short-term, U.S. investment-grade, corporate & securitized bond funds, like JPLD.
- Ultra-Short-term, U.S. investment-grade, corporate bond funds, like PULS.
- US Treasury Bills of 1 year, or Treasury Notes of 2, 3, 4 or 5 years, 3.90% to 4.35%.
- Bank high-yield savings or brokerage house money market accounts 3.60% min.
- FDIC bank or NCUA credit union, 1 to 5 yr, non-callable CDs, paying at least 4.00%.
- U.S. Savings I-Bonds, which have a max contribution of $10,000 per account per year, are tax-deferred for 30 years, do not drop in value as bonds drop in value when interest rates rise, interest is paid and compounded monthly, and the interest rate resets every six months based on inflation (the higher the inflation, the higher the interest rate).
The bottom option in the list above, U.S. Savings I-Bonds, is the most credit-safe and has the lowest volatility but potentially the lowest returns. These eight safe money ideas above are in order, with the highest volatility item on top and the lowest volatility item on the bottom. We recommend everyone spread their “safe money” over at least five of the eight ideas above.
Due to the low return of these investment products, investors should not put 100% or anything close to that in these products. These products are only for an investor’s safest money or perhaps 5% to 40% of an investor’s total portfolio as based on the investor’s risk profile. These products are mostly credit safe, but they will not provide the growth or income needed to stay ahead of, or even keep up with, taxes plus inflation.
Past performance is not a guarantee of future results.
Pop Quiz Answer
After all employees are paid a fair and competitive wage, all the company’s suppliers are paid, all payments on the company’s debt are paid, all taxes are paid, current dividends are paid to all stockholders, and all other accounts payable are paid, what remains are the company’s profits. What are the six options a company has regarding how to utilize those profits?
Answer:
- Pay down the company’s debt.
- Increase dividends to stockholders.
- Buy back company stock.
- Add to the company’s Research & Development budget.
- Buy other companies to become more integrated or buy out a competitor.
- Increase capital expense (also called Cap Ex, which means buying new equipment, expanding existing factories, or building new factories).
The latter is what Alphabet, Amazon, Meta, and Microsoft are doing as they build data centers.